Splunk dashboards (health views)
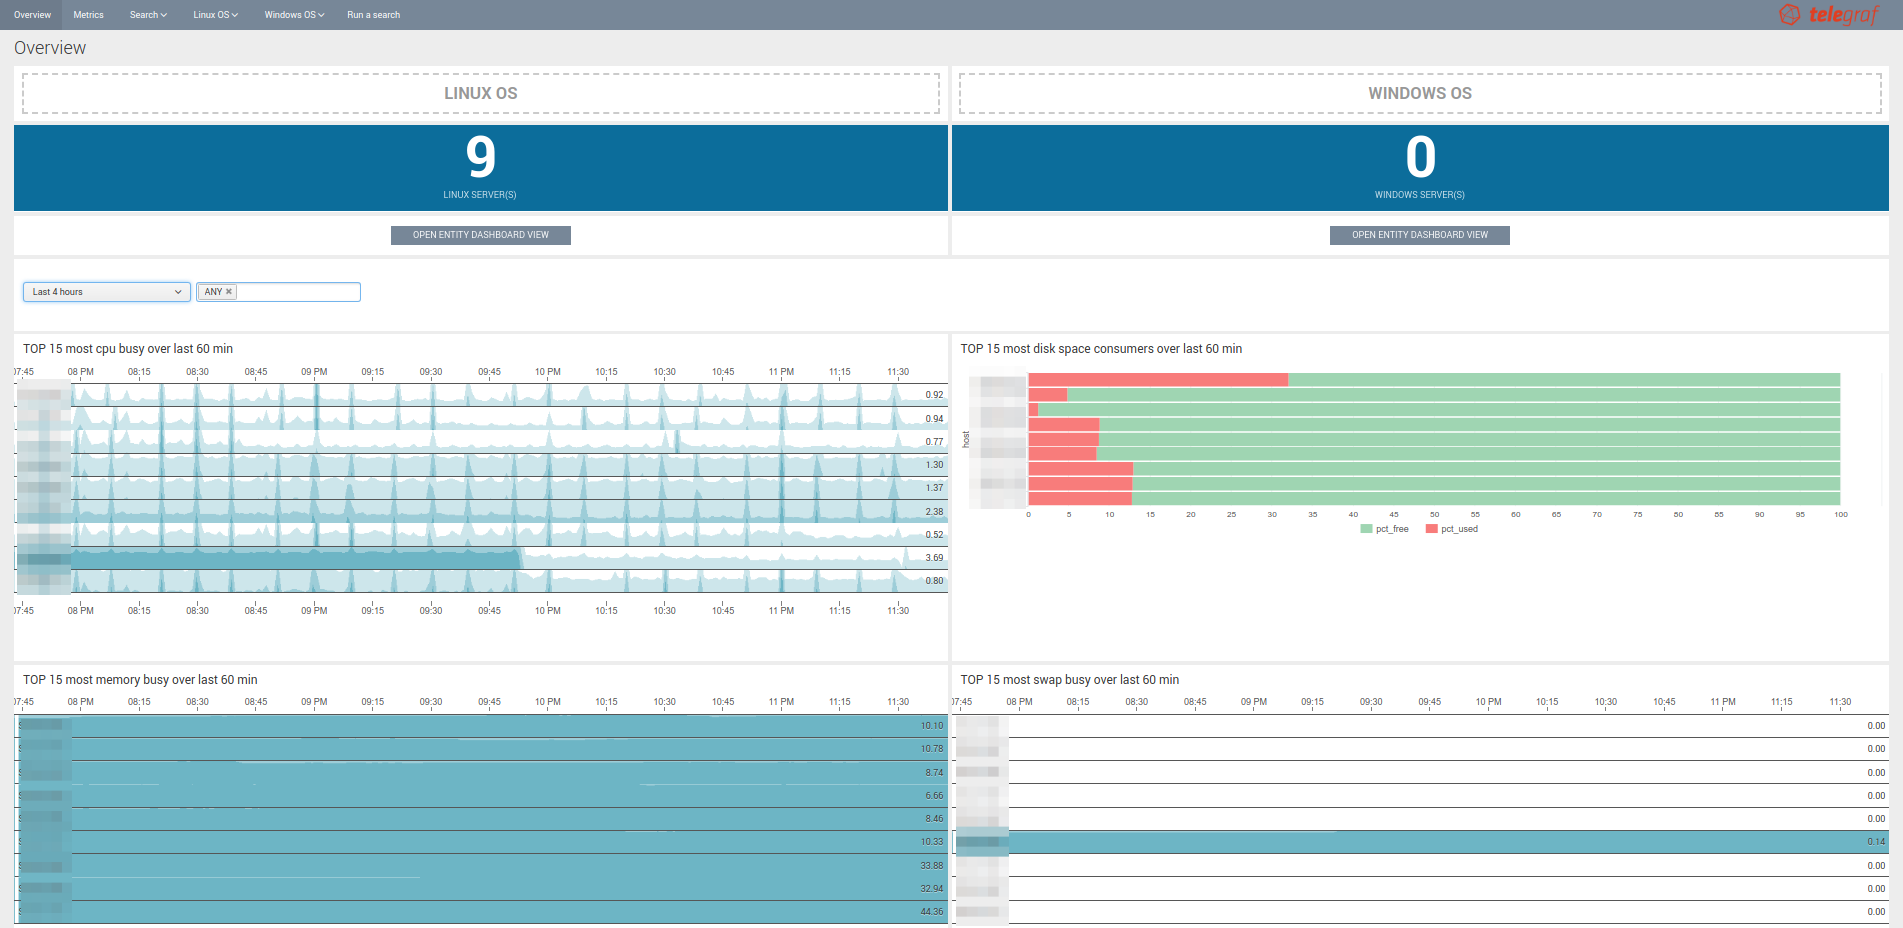
Overview (landing page)
The Splunk application home page provides an overview of the Kafka infrastructure:
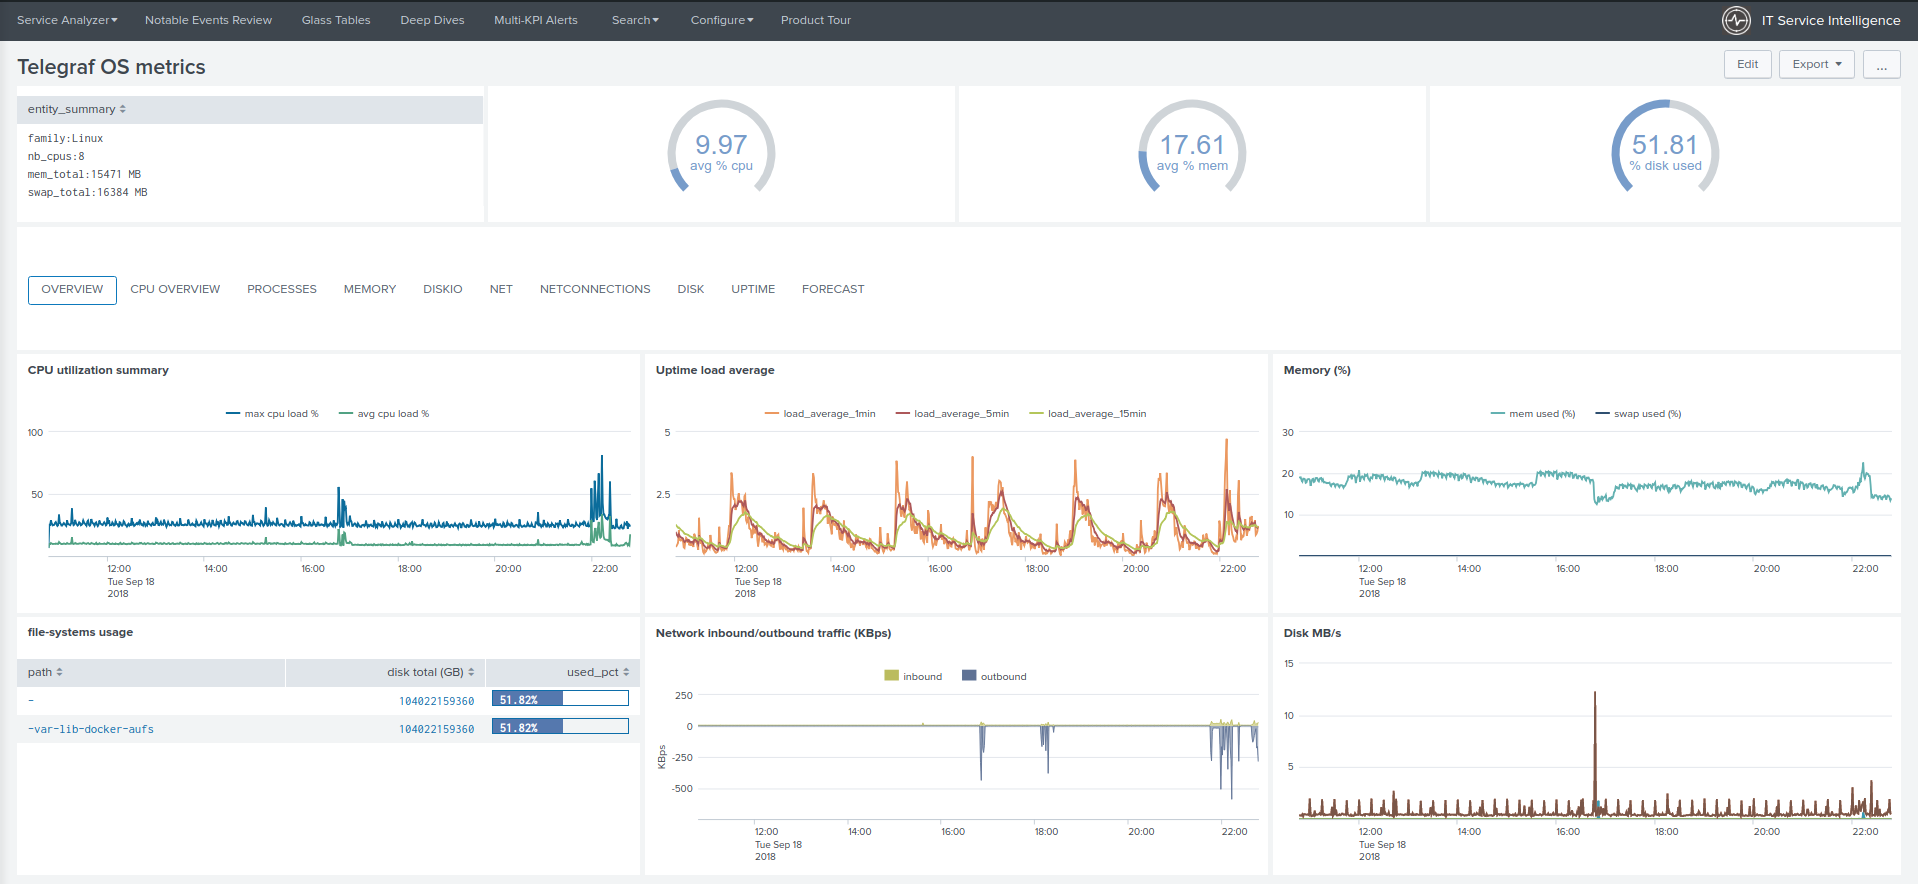
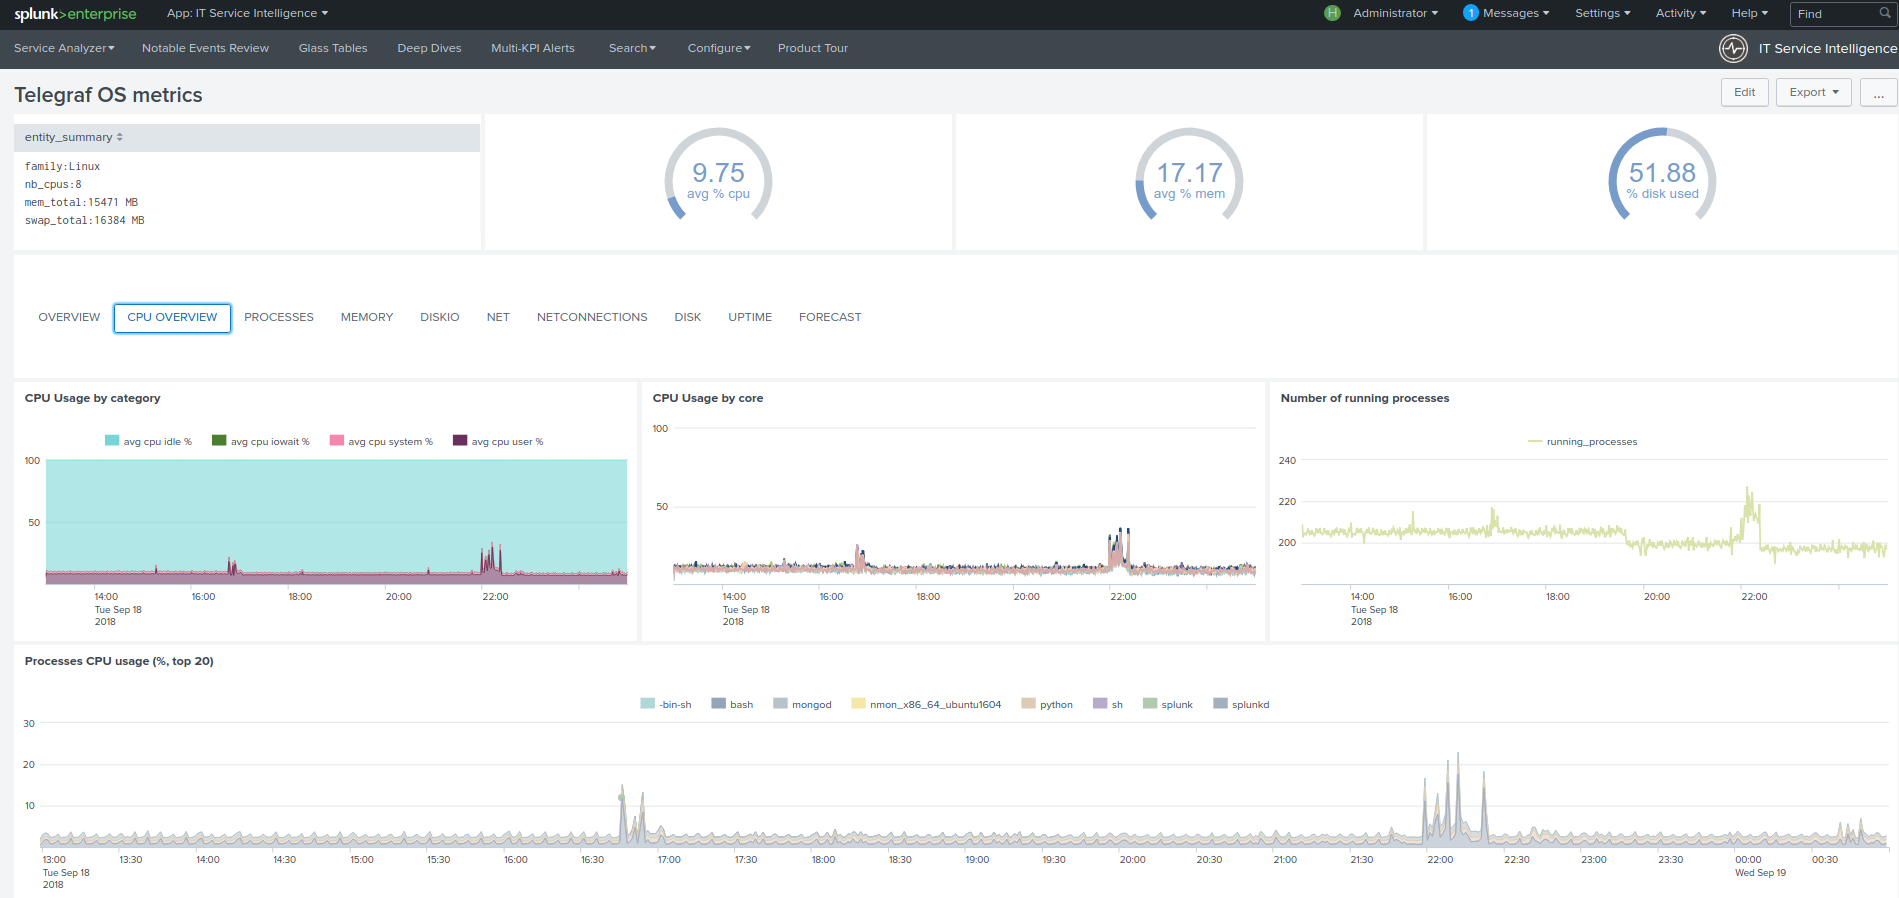
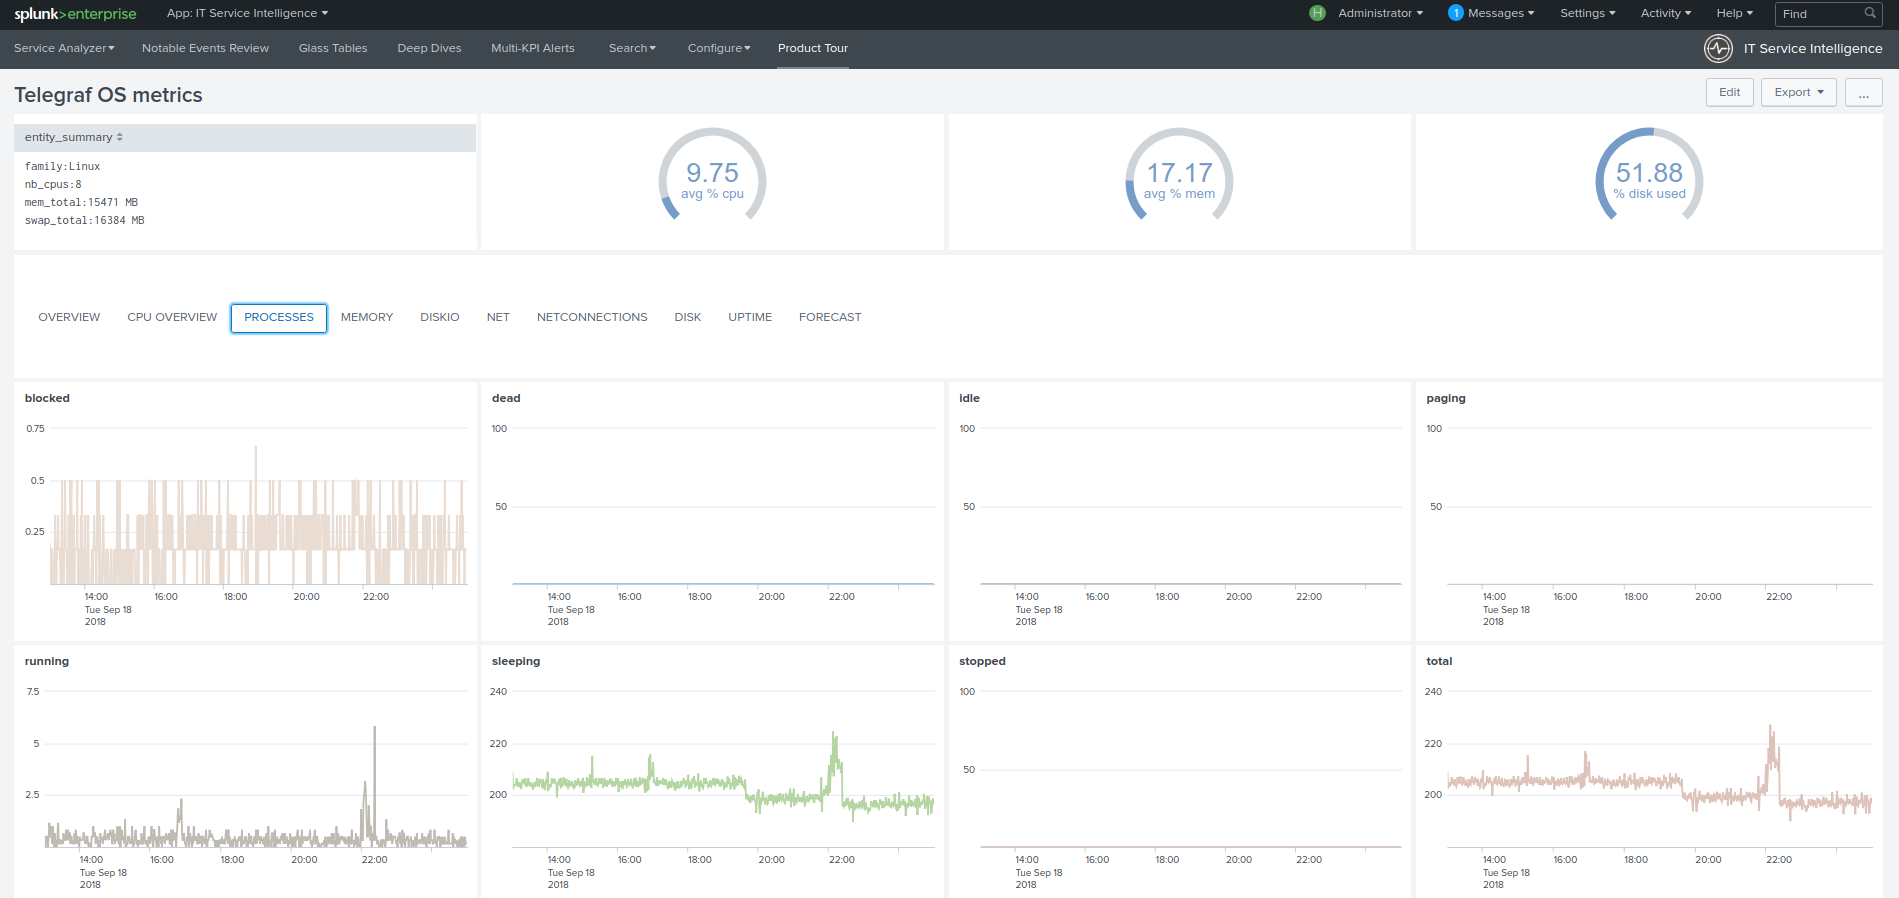
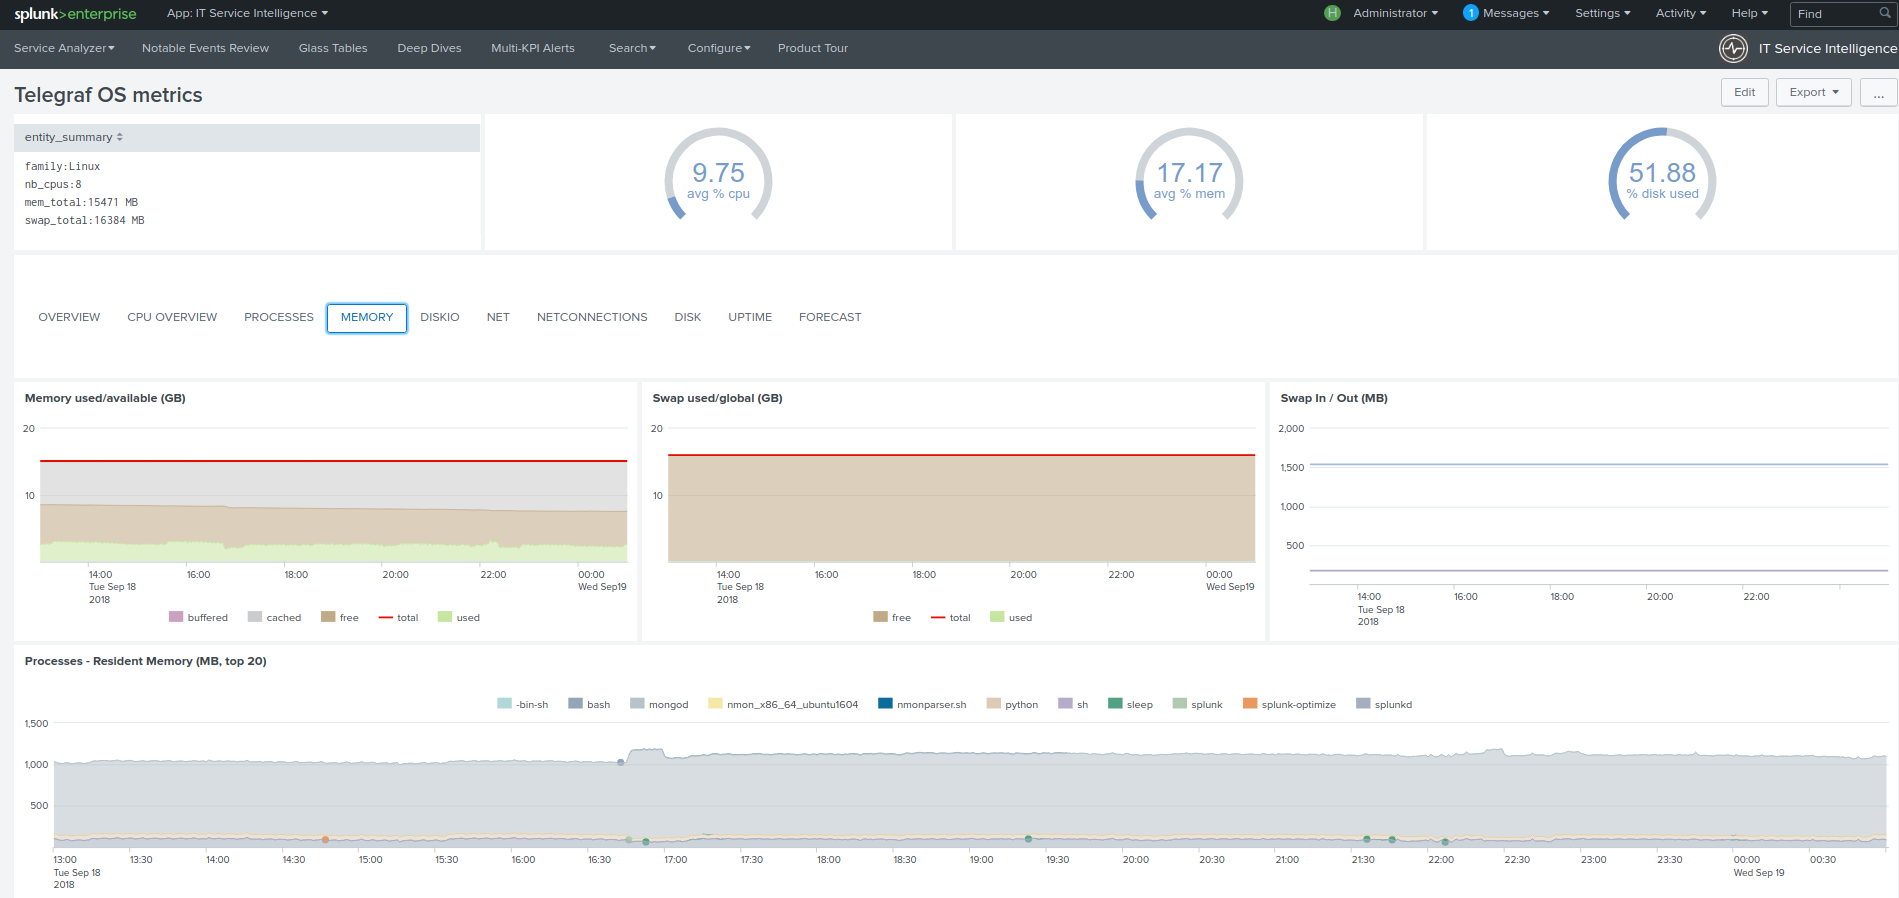
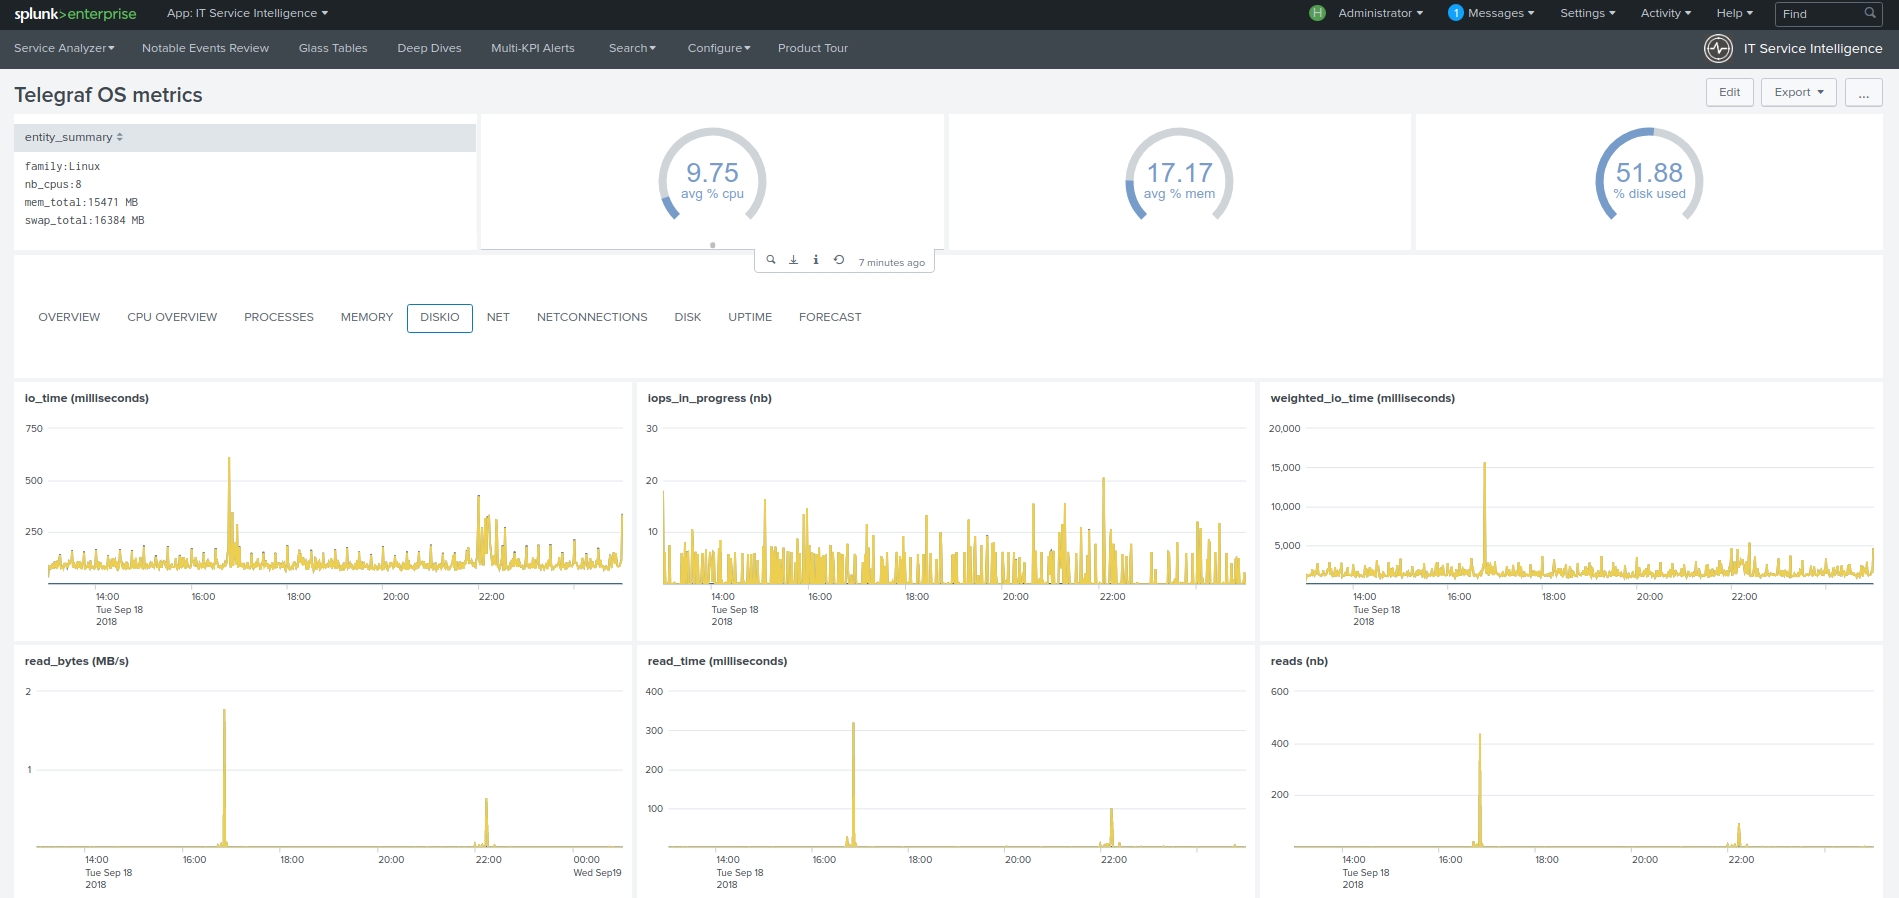
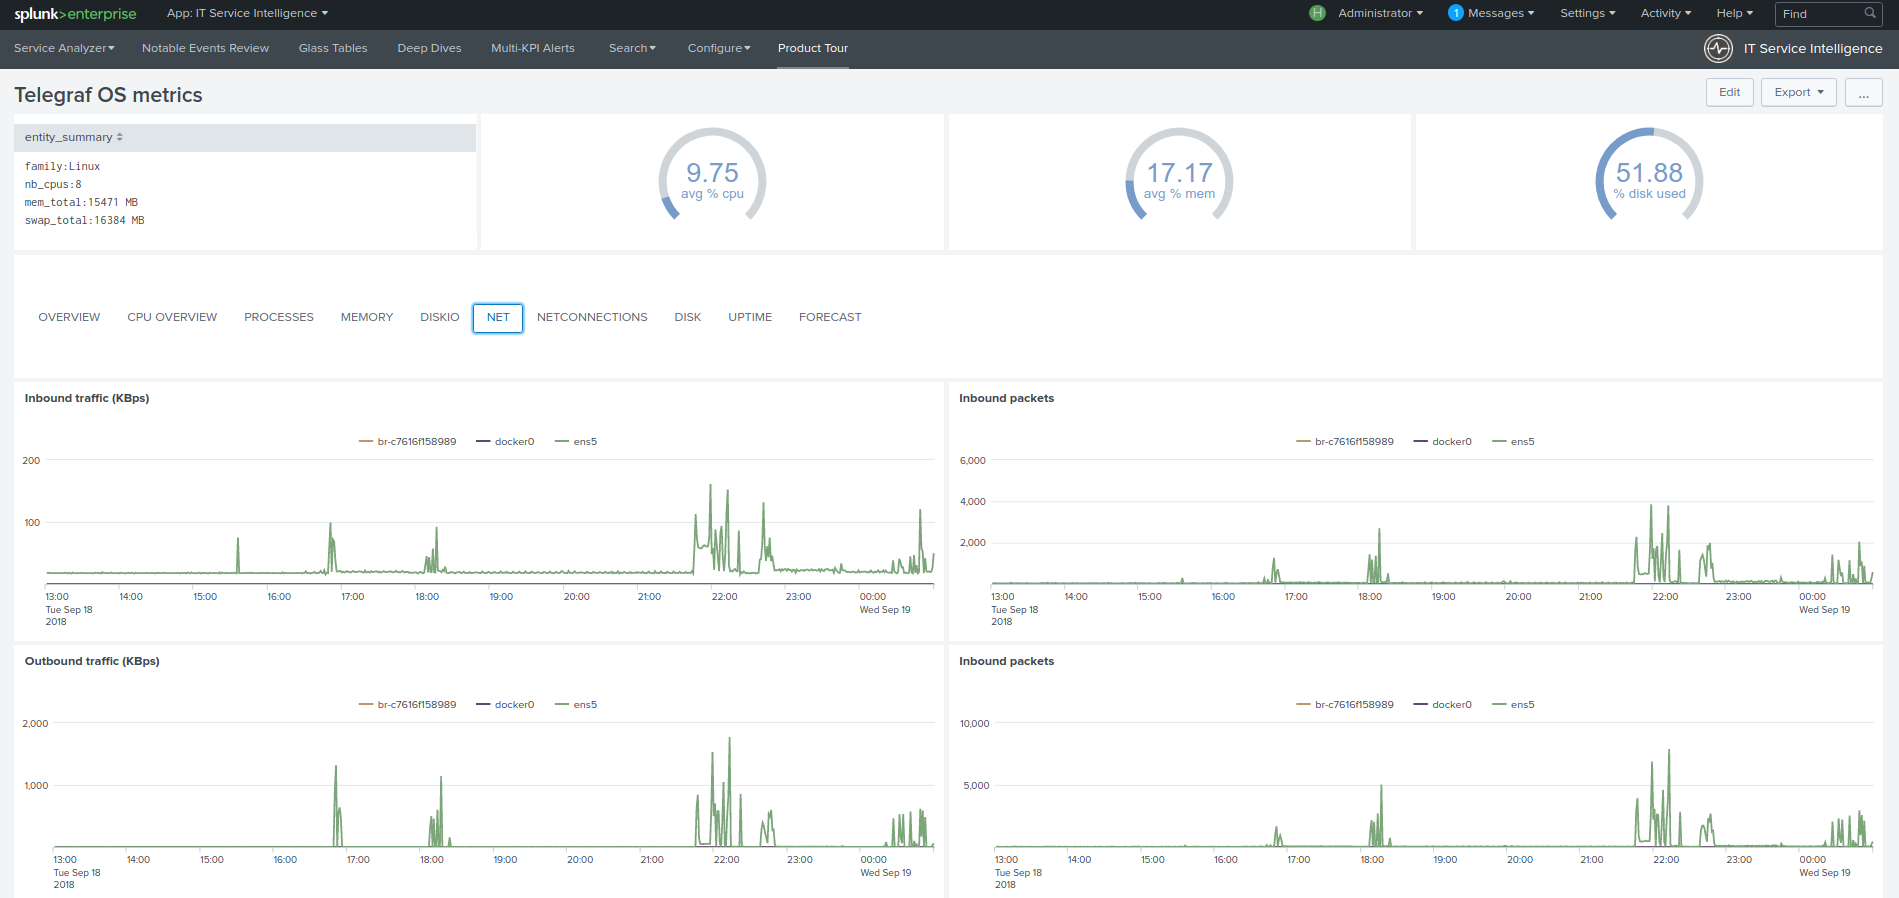
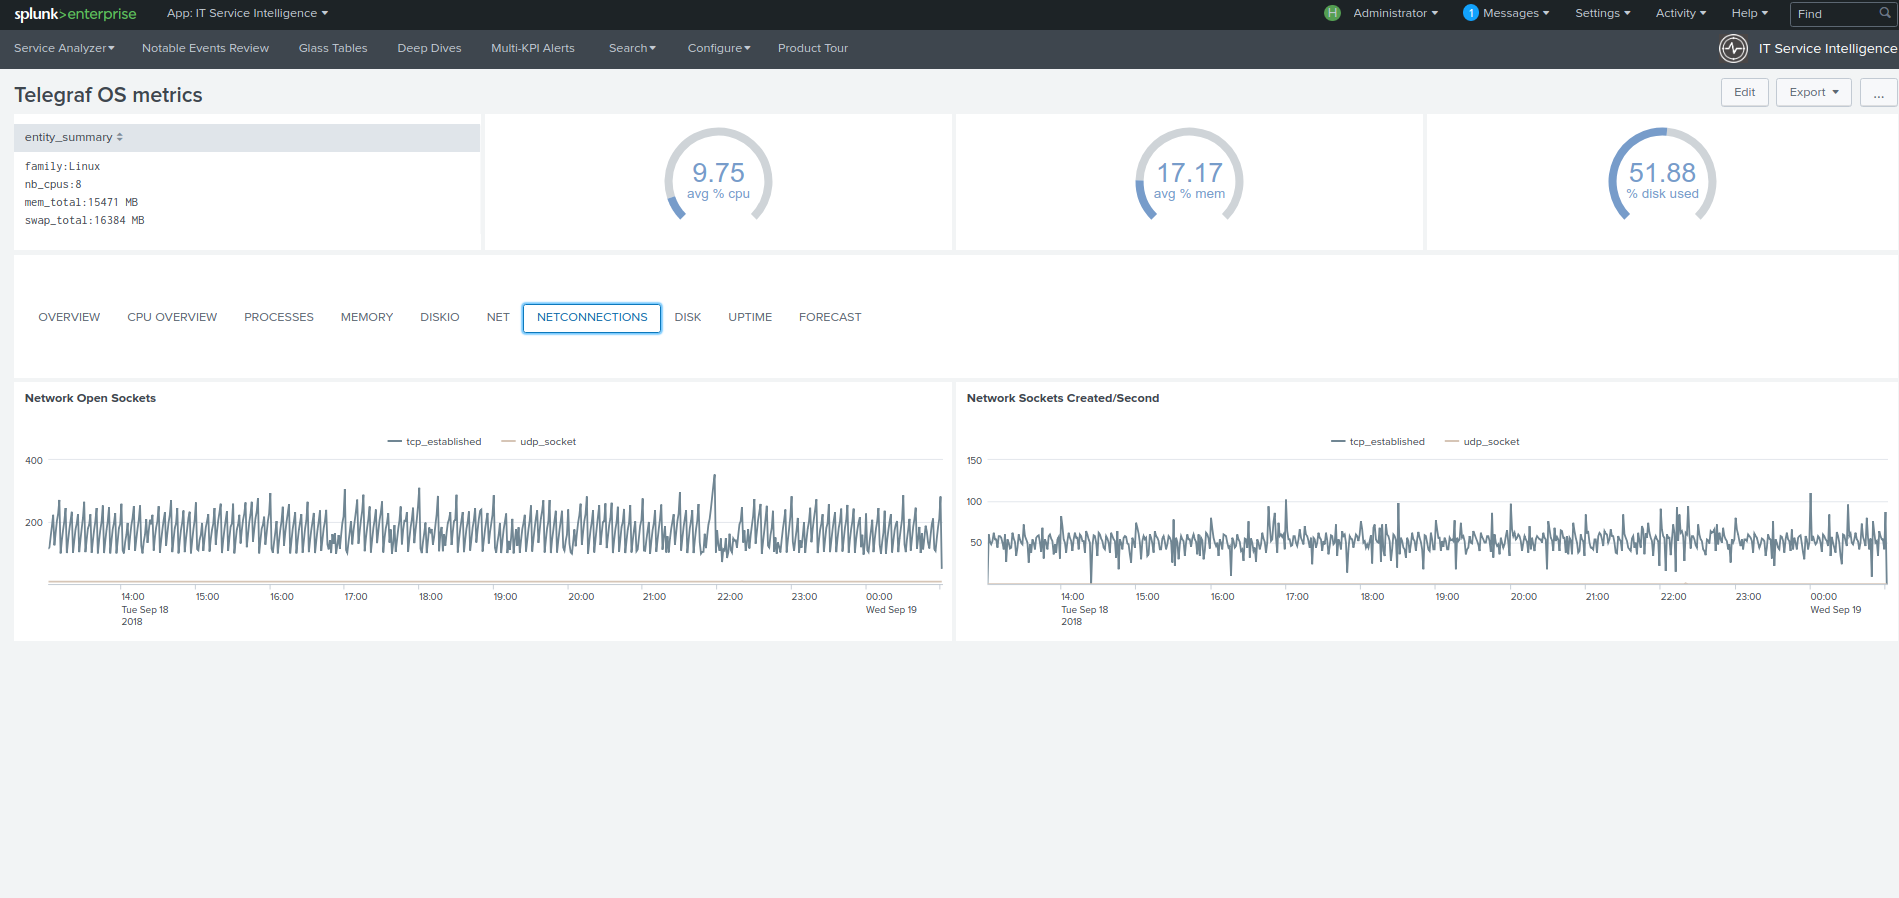
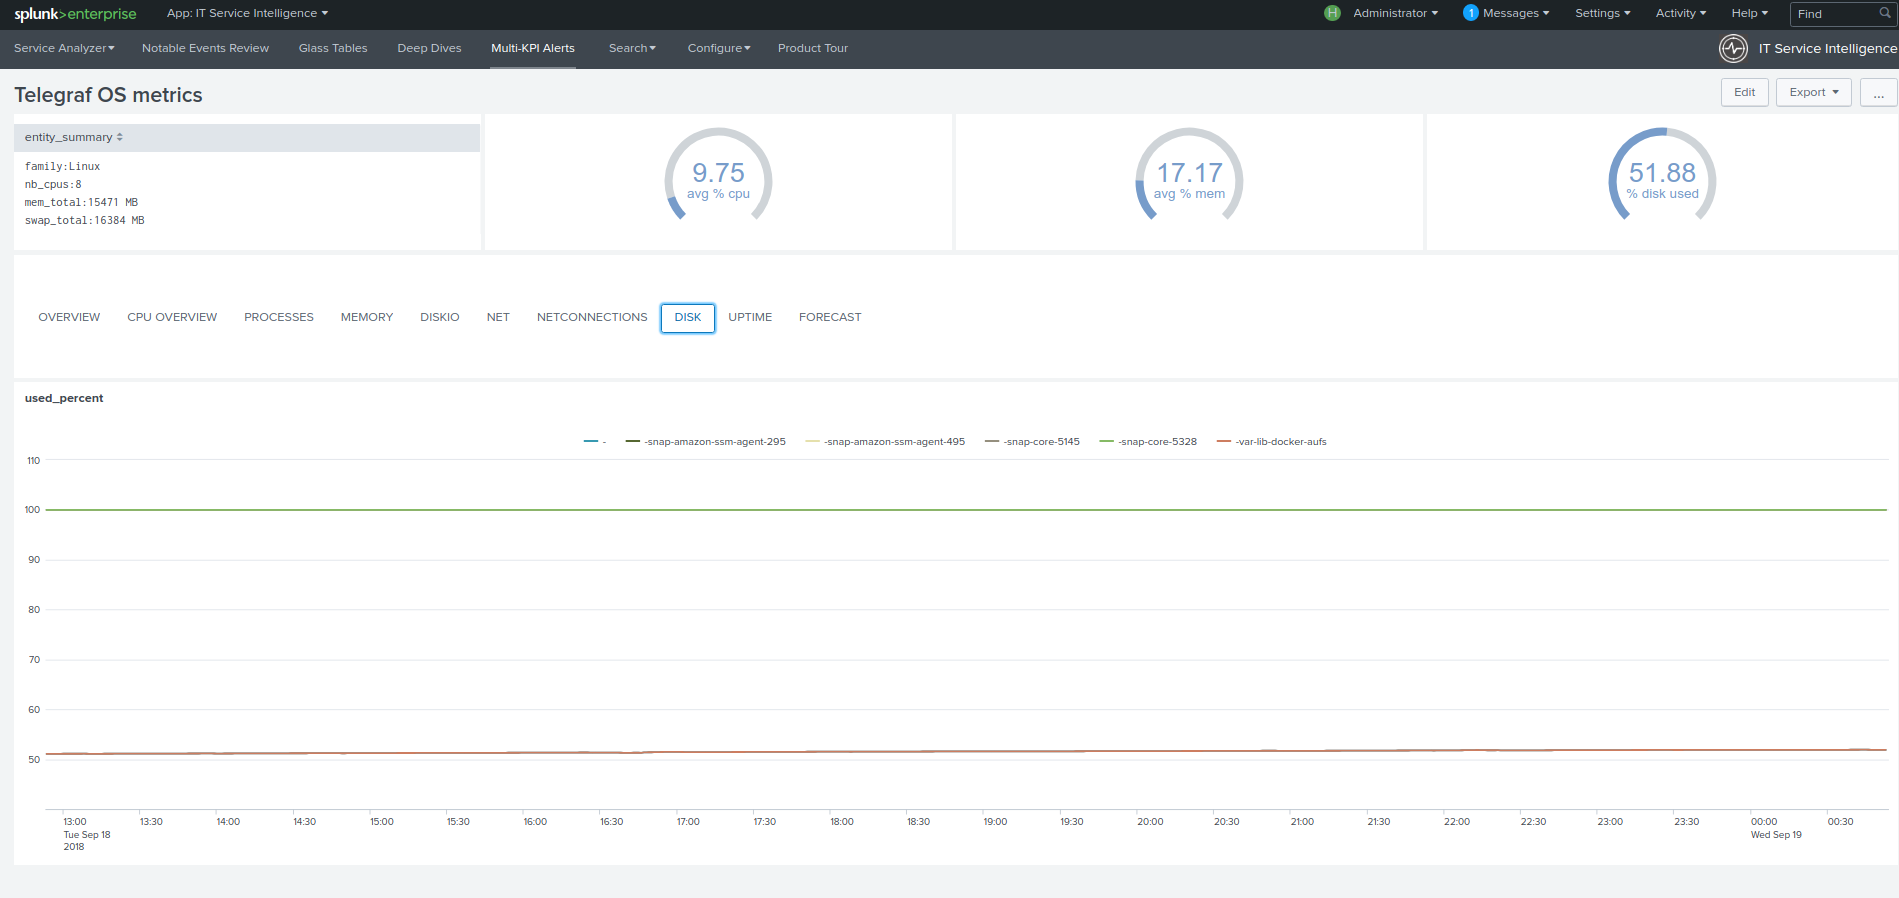
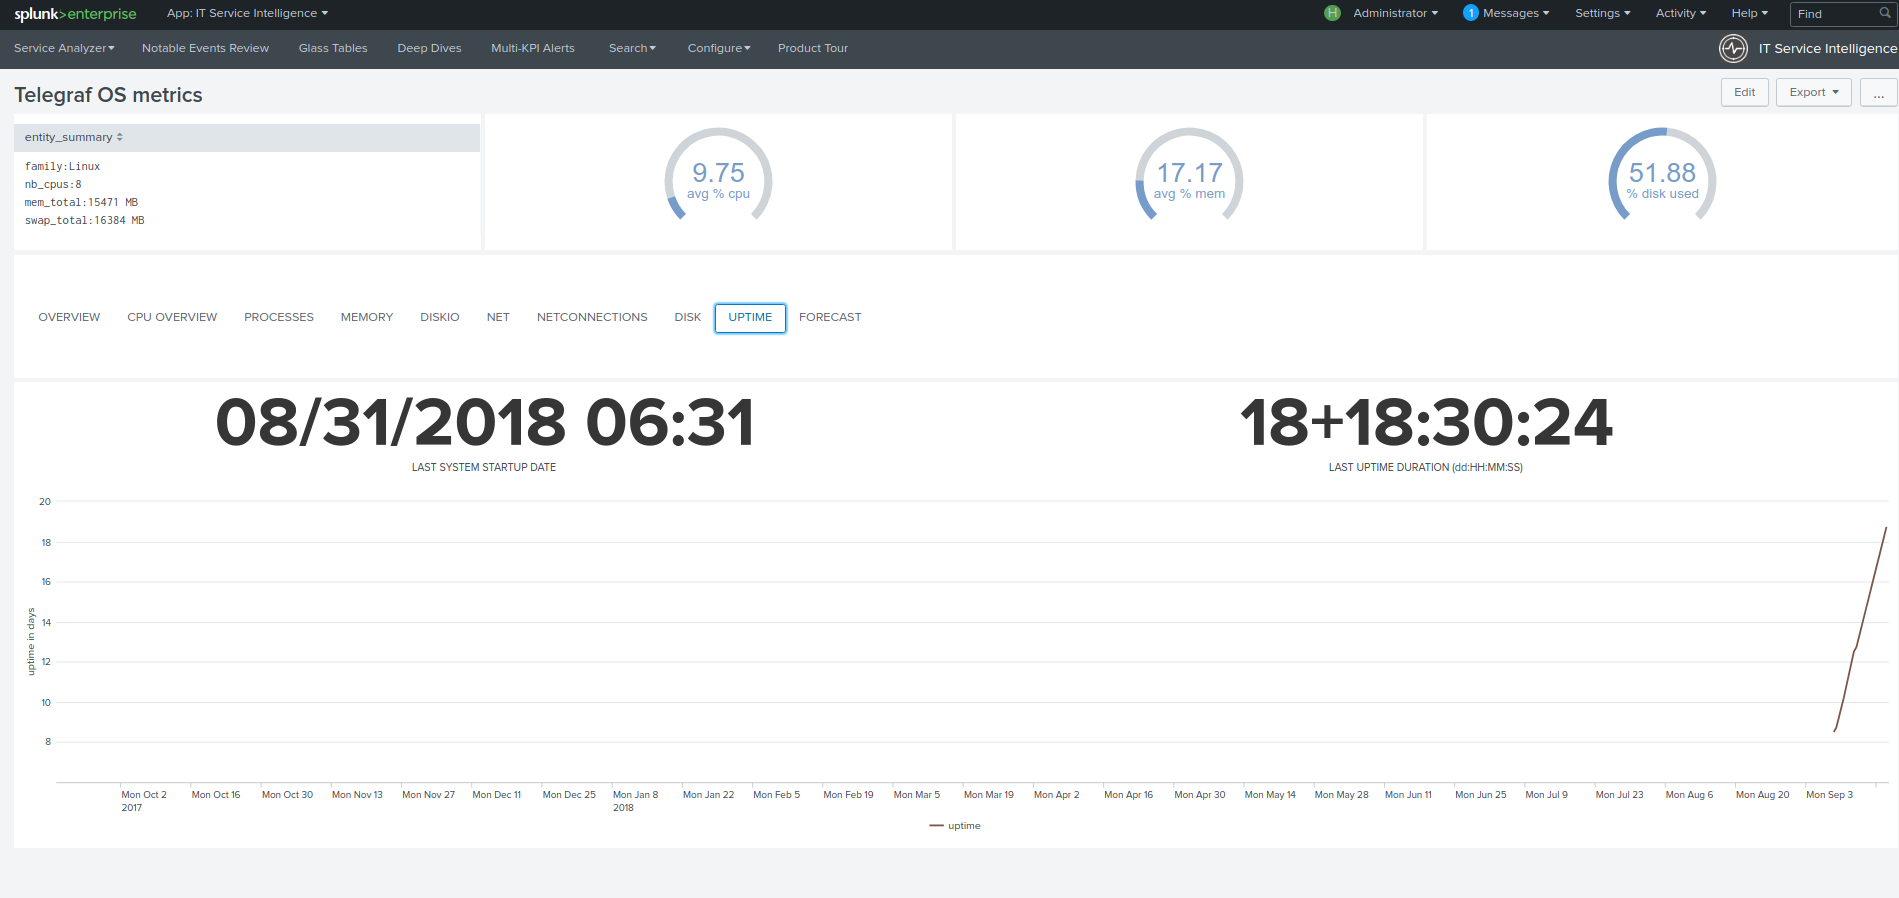
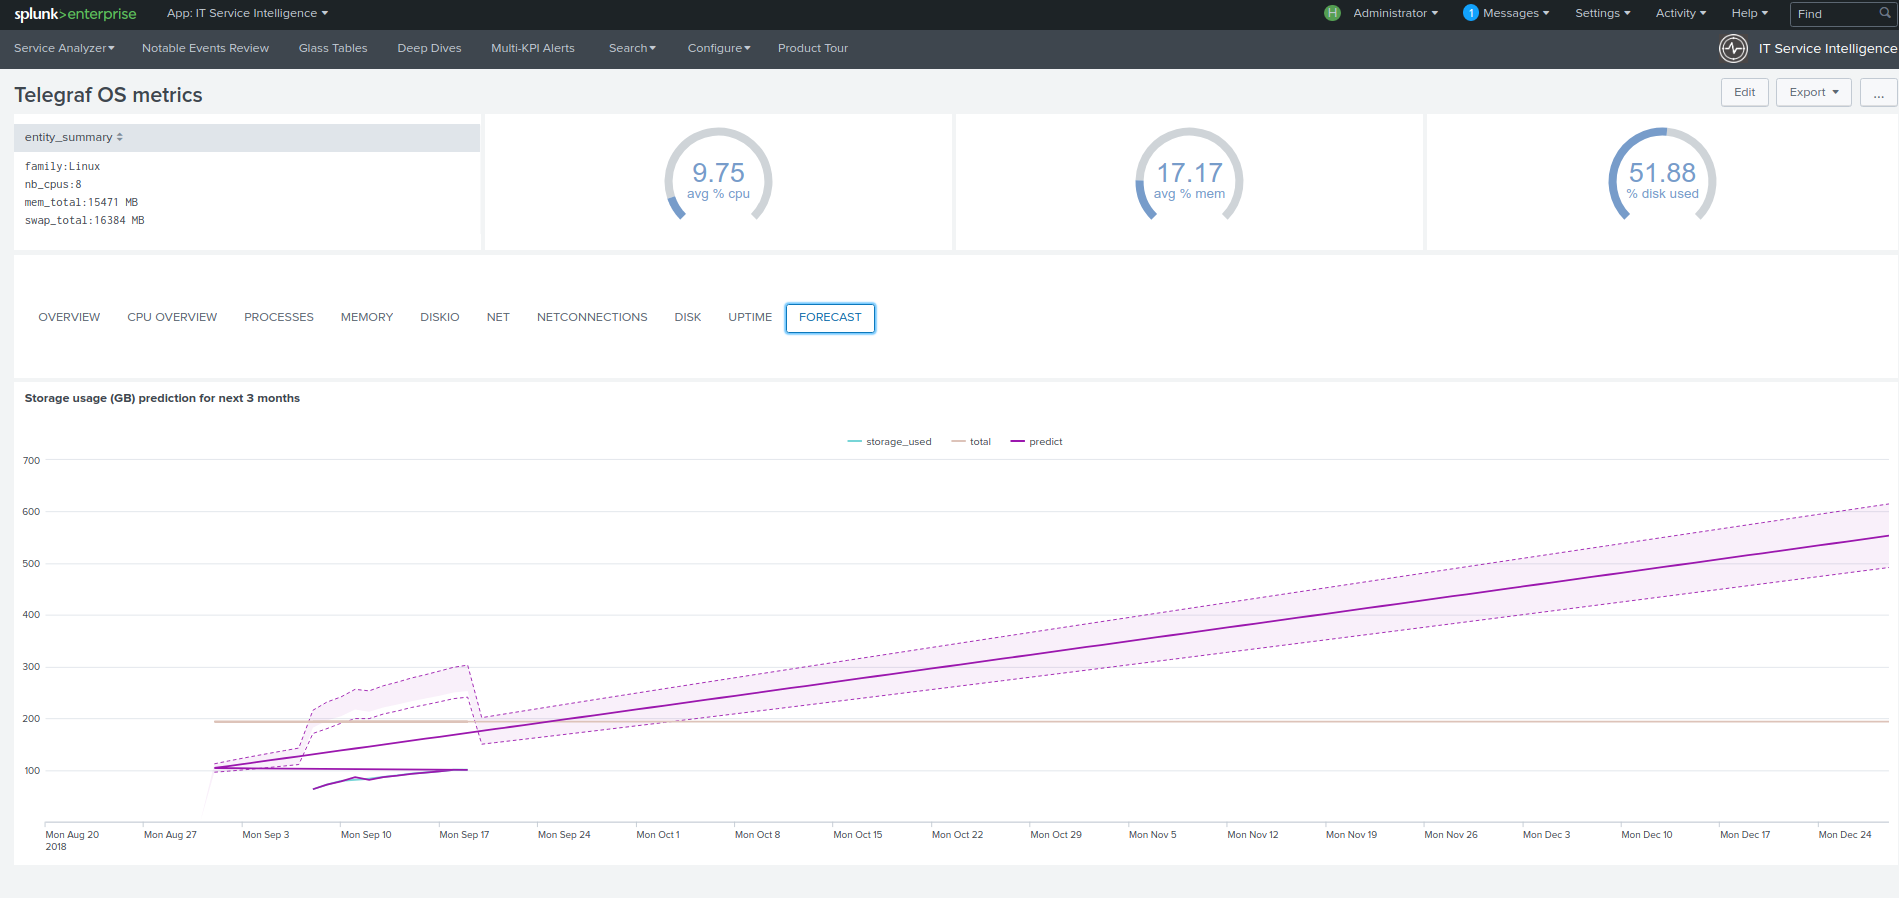
View for Linux OS
The Health view for Linux OS automatically appears as “Telegraf OS (Linux)” deepdive drilldown link when entities are discovered:
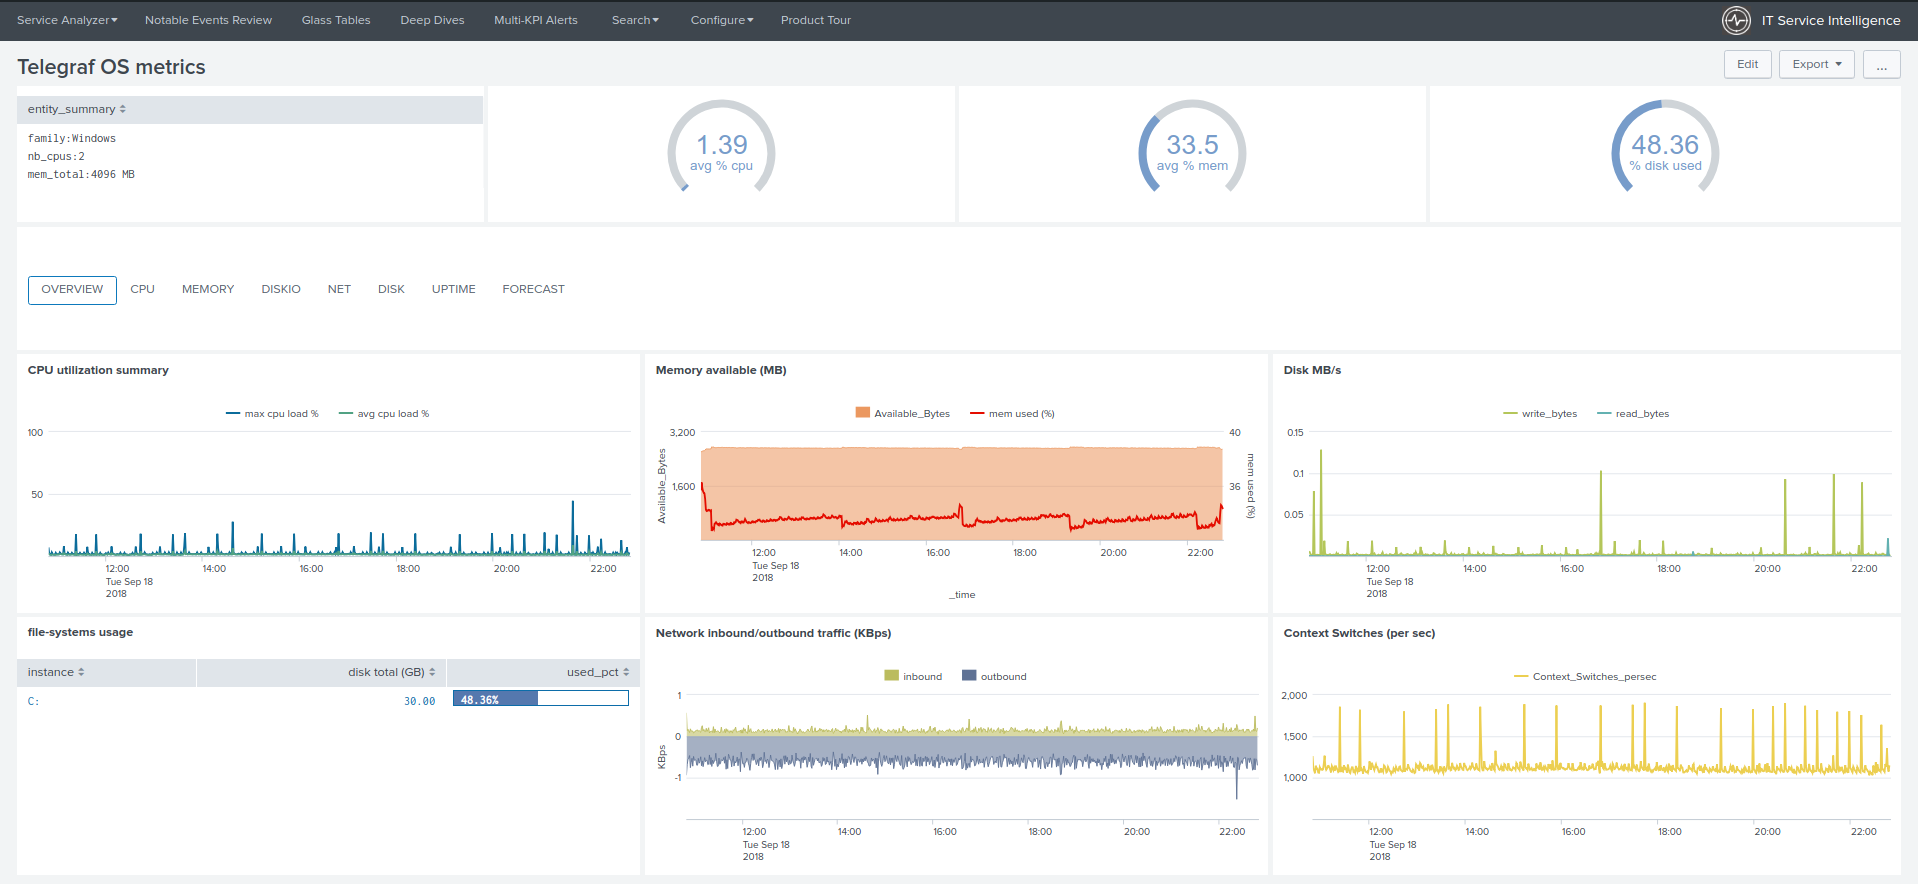
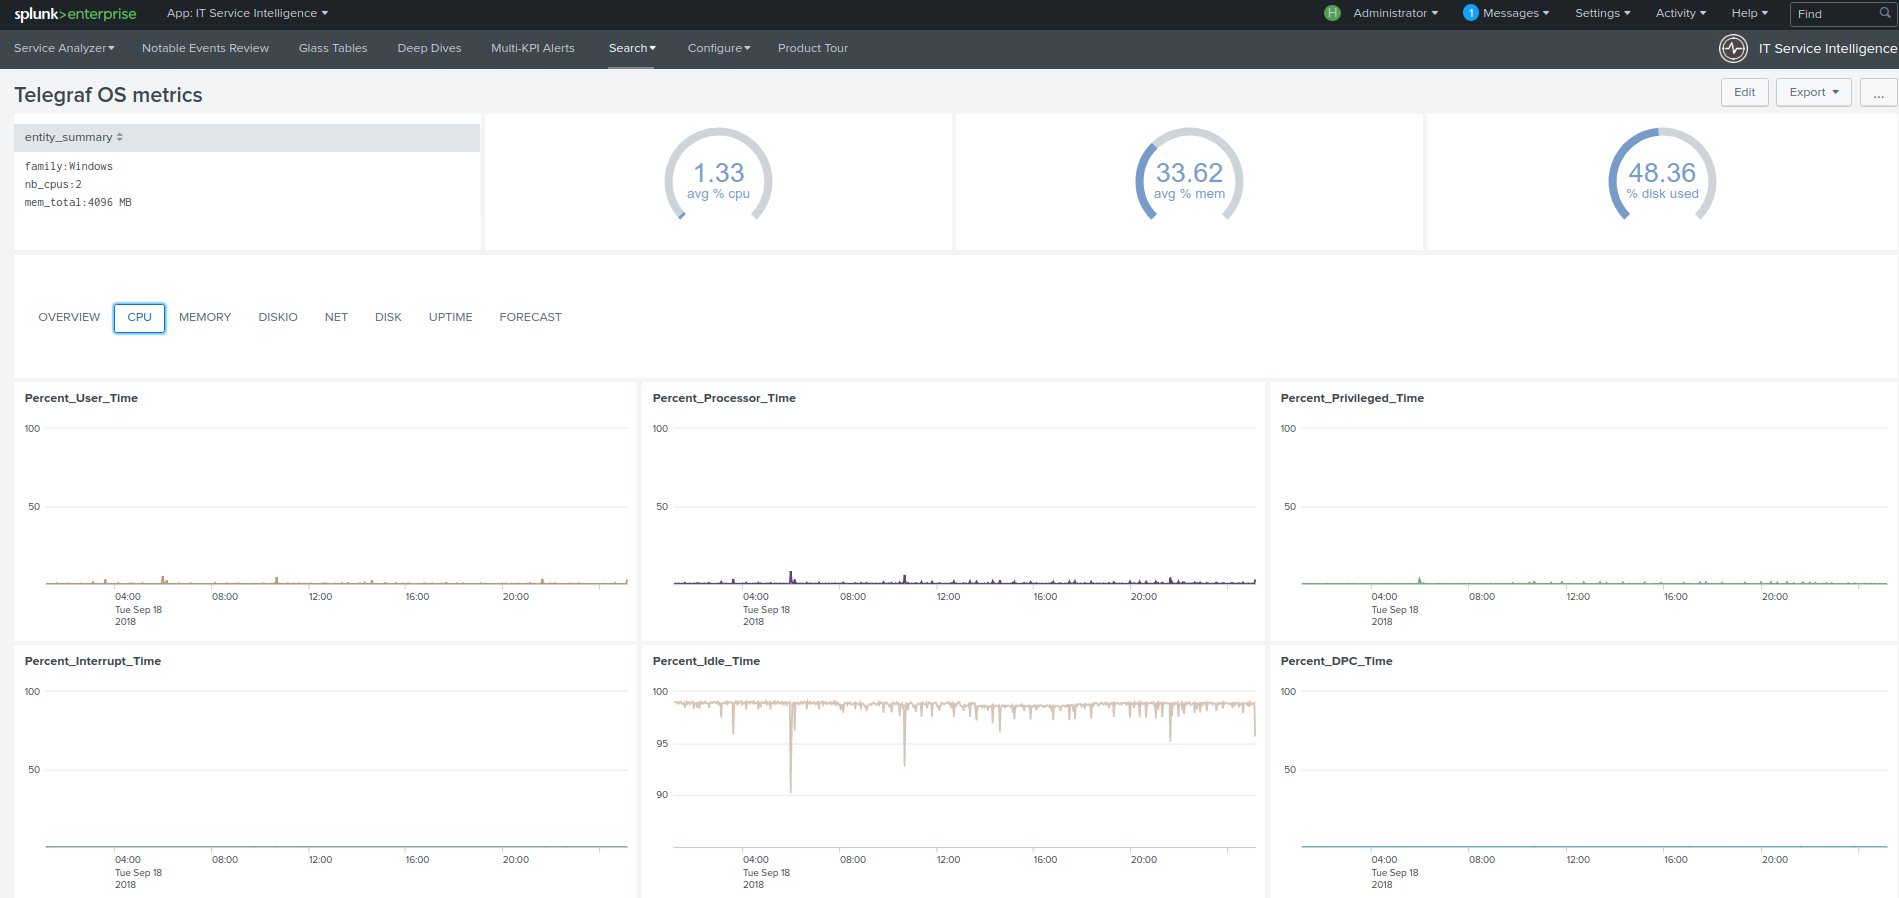
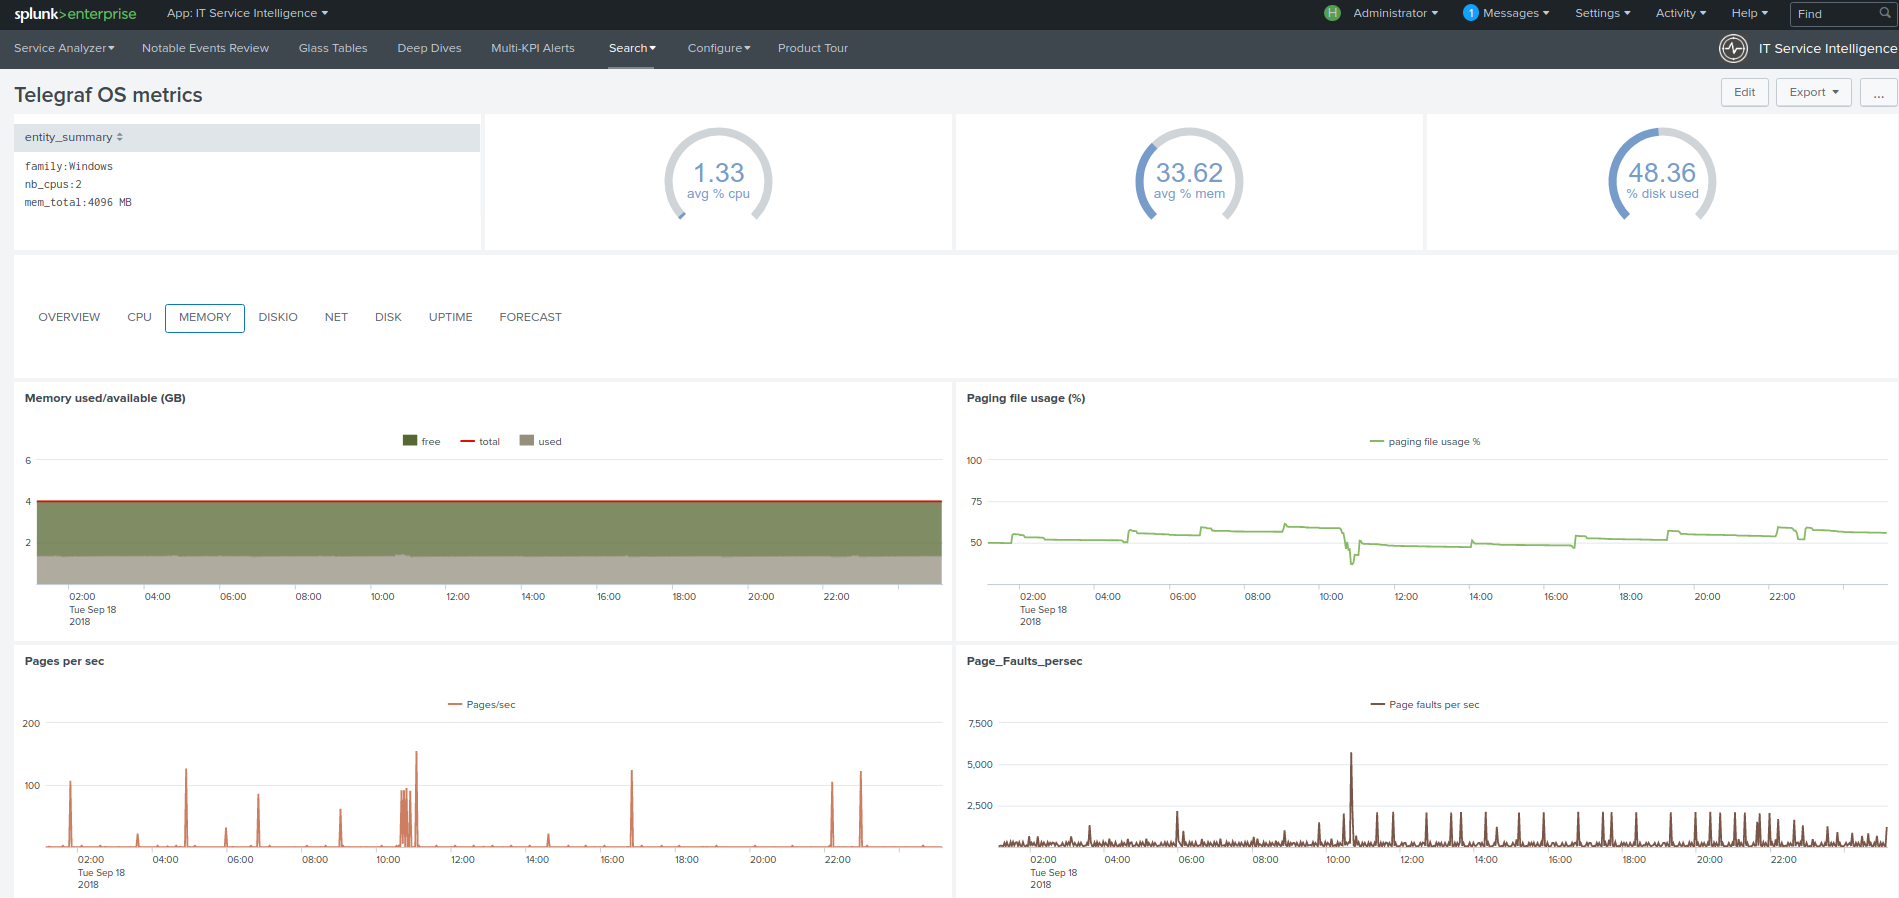
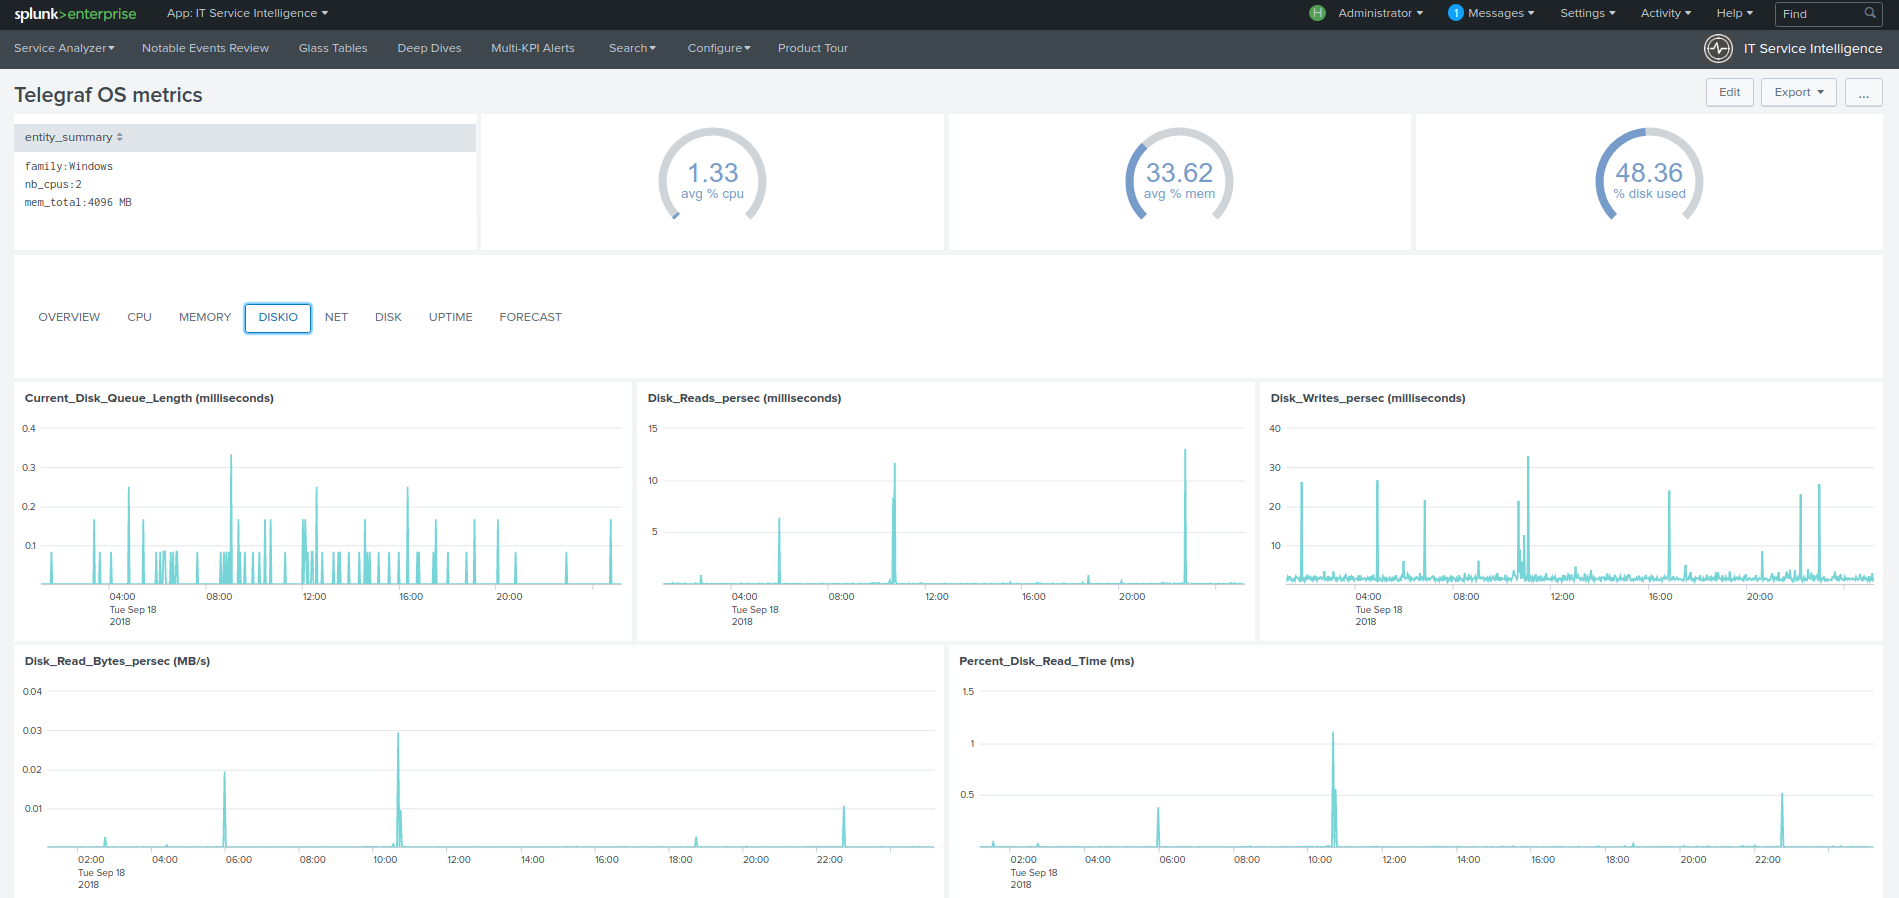
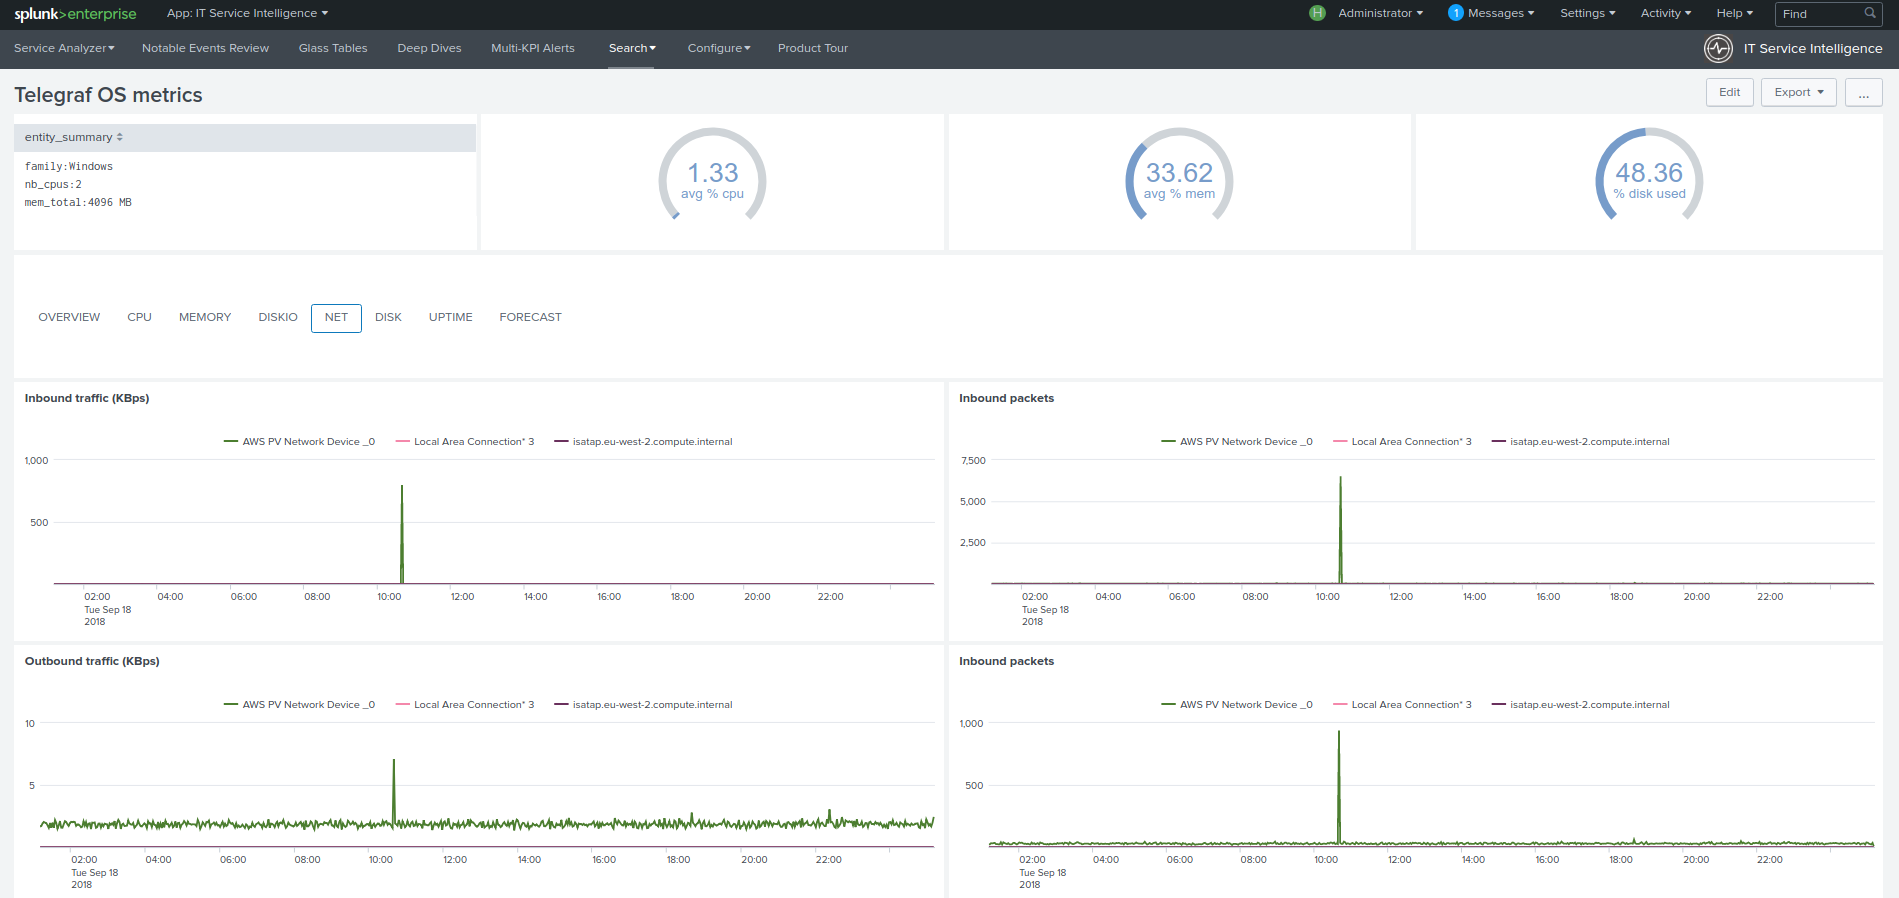
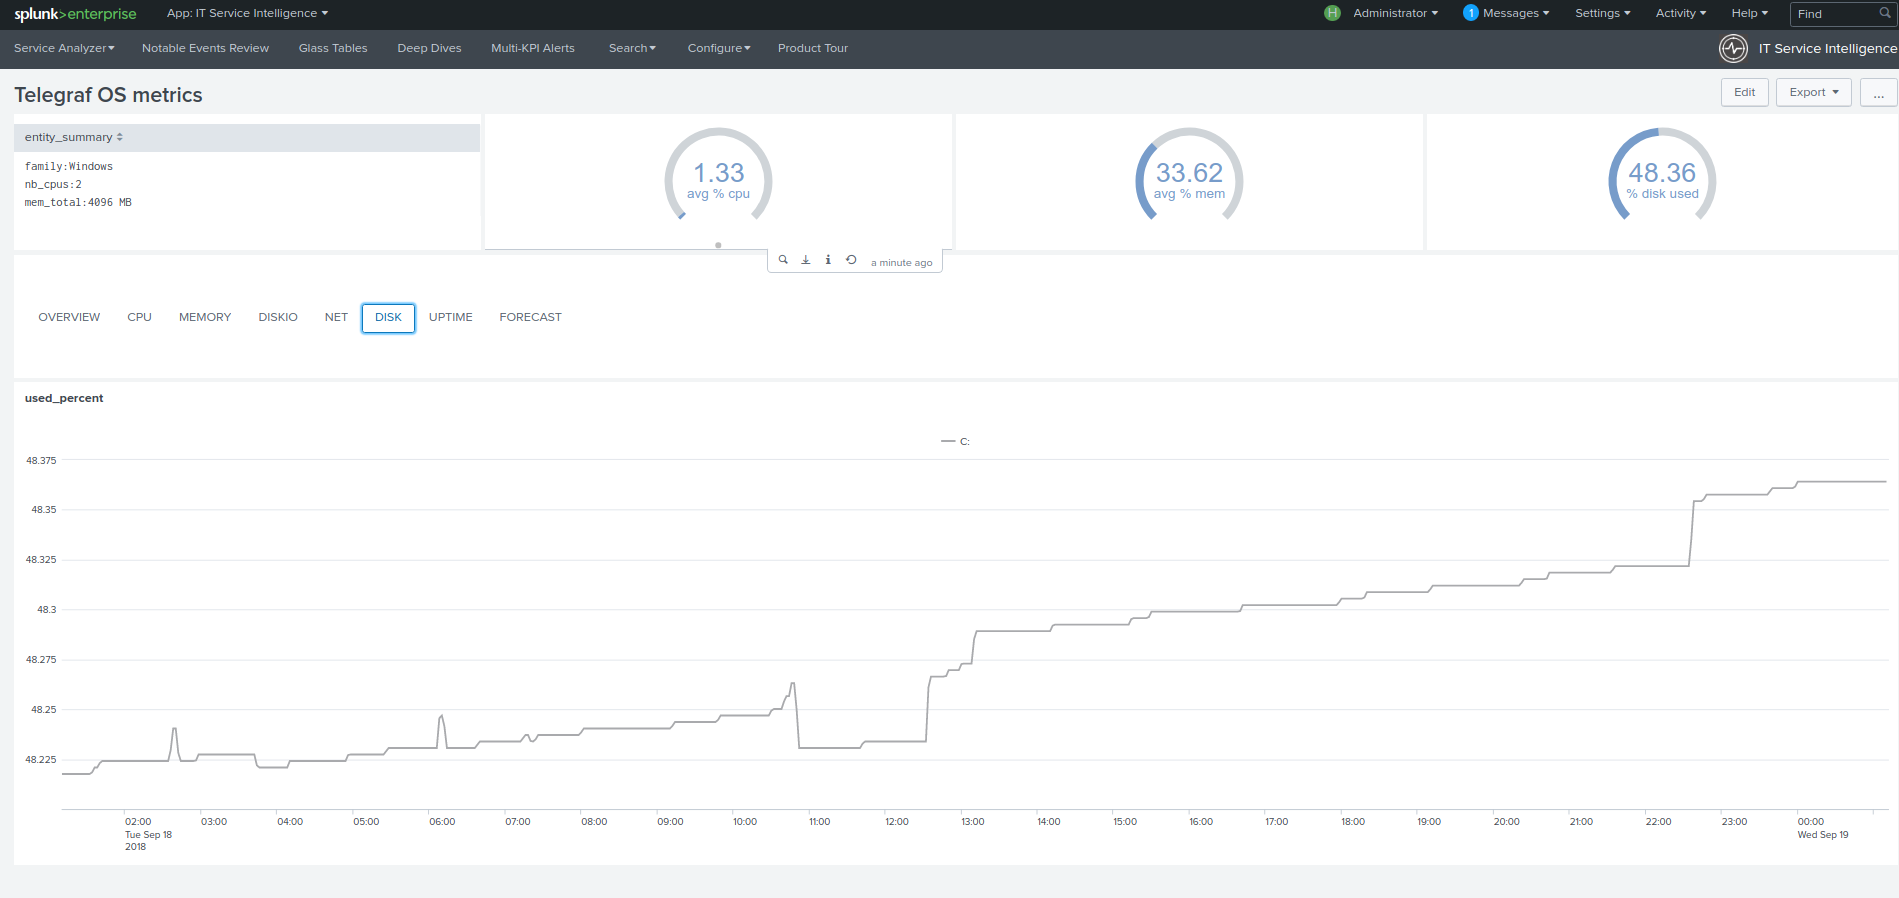
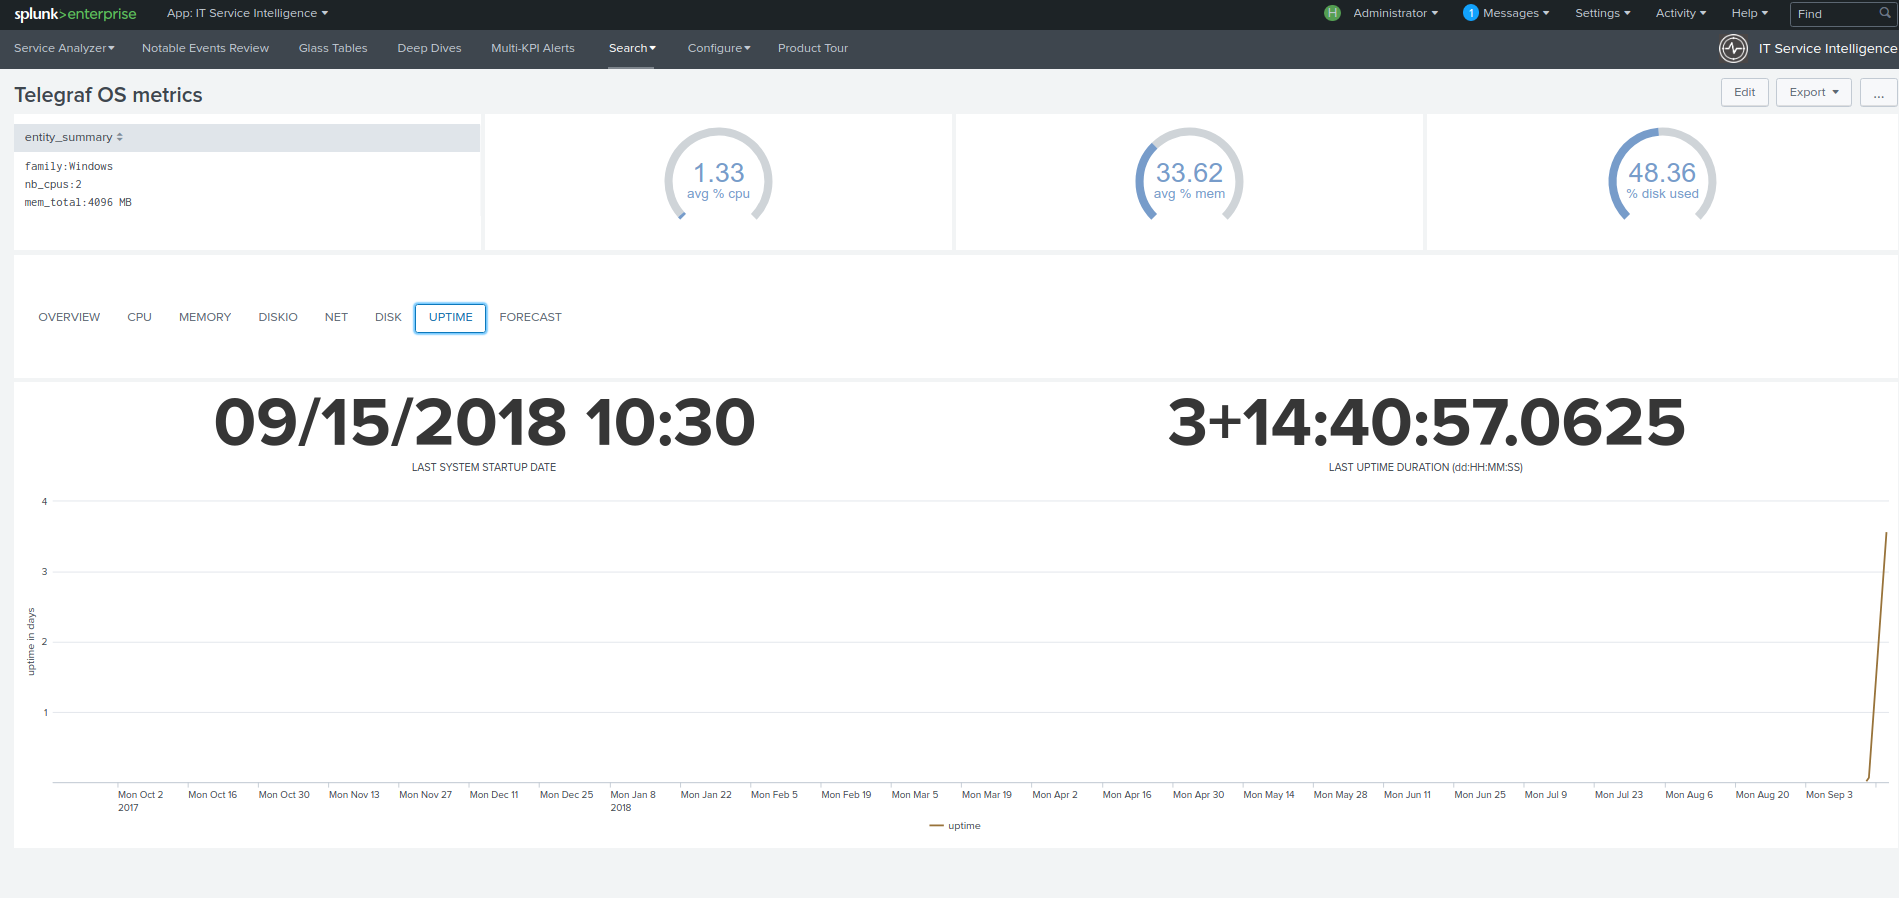
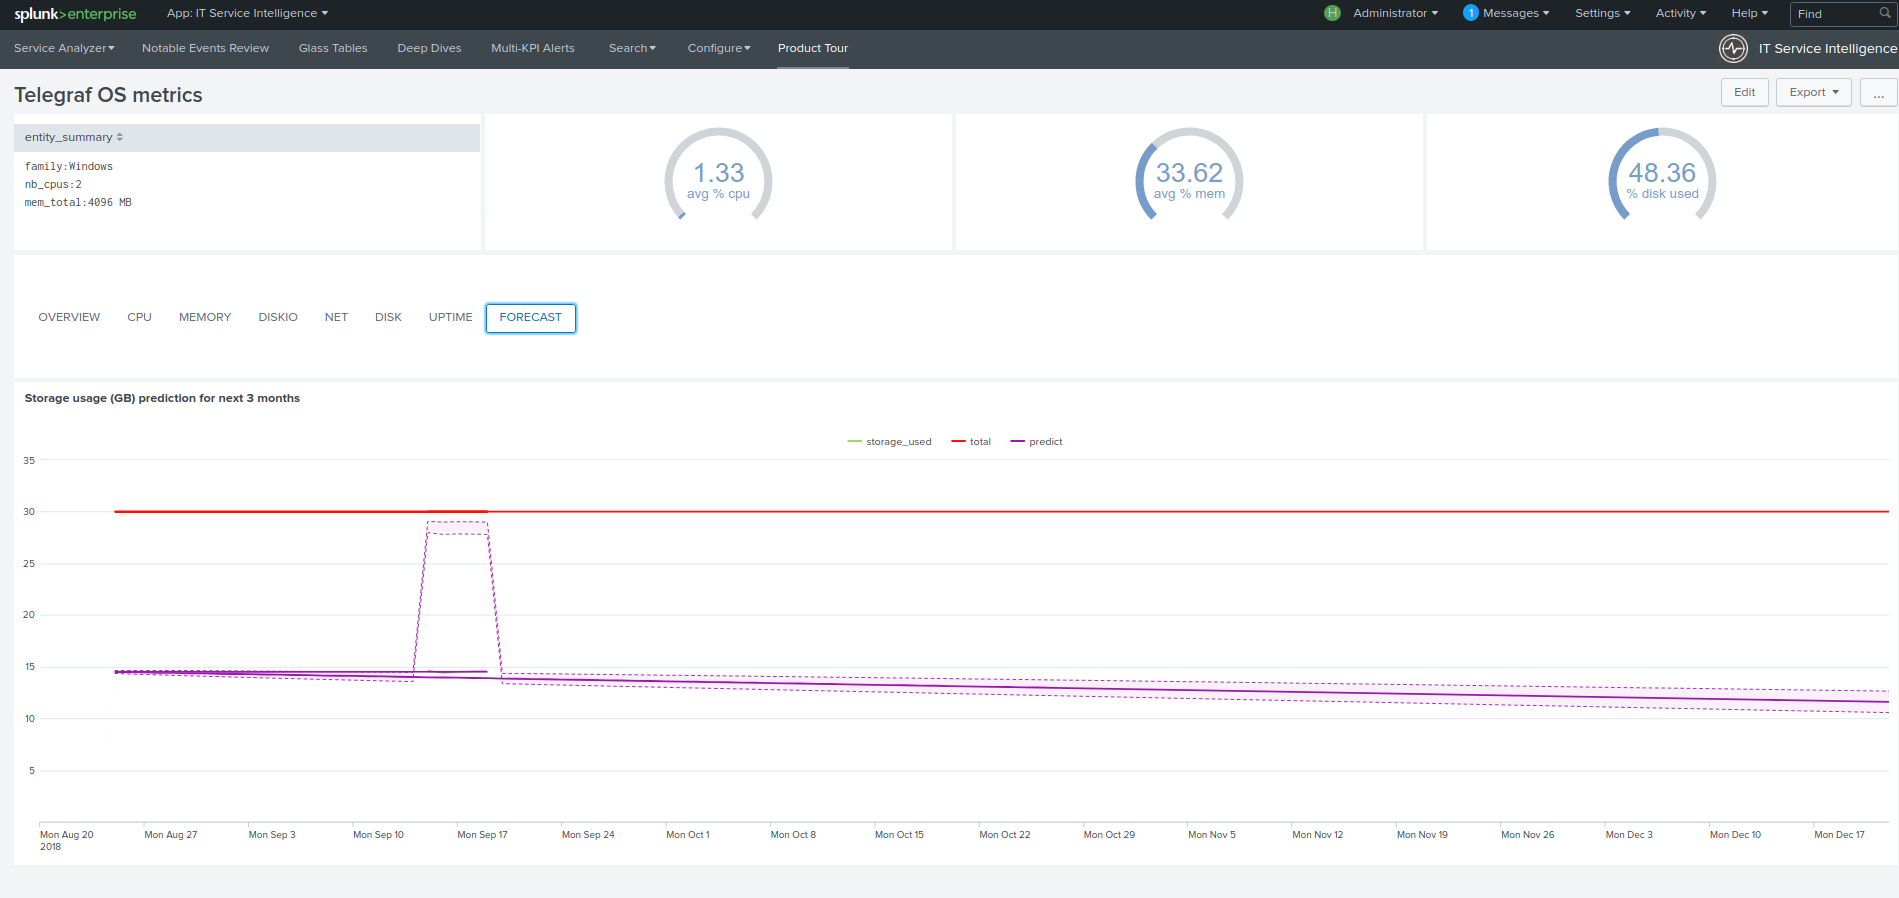
View for Windows OS
The Health view for Linux OS automatically appears as “Telegraf OS (Windows)” deepdive drilldown link when entities are discovered:
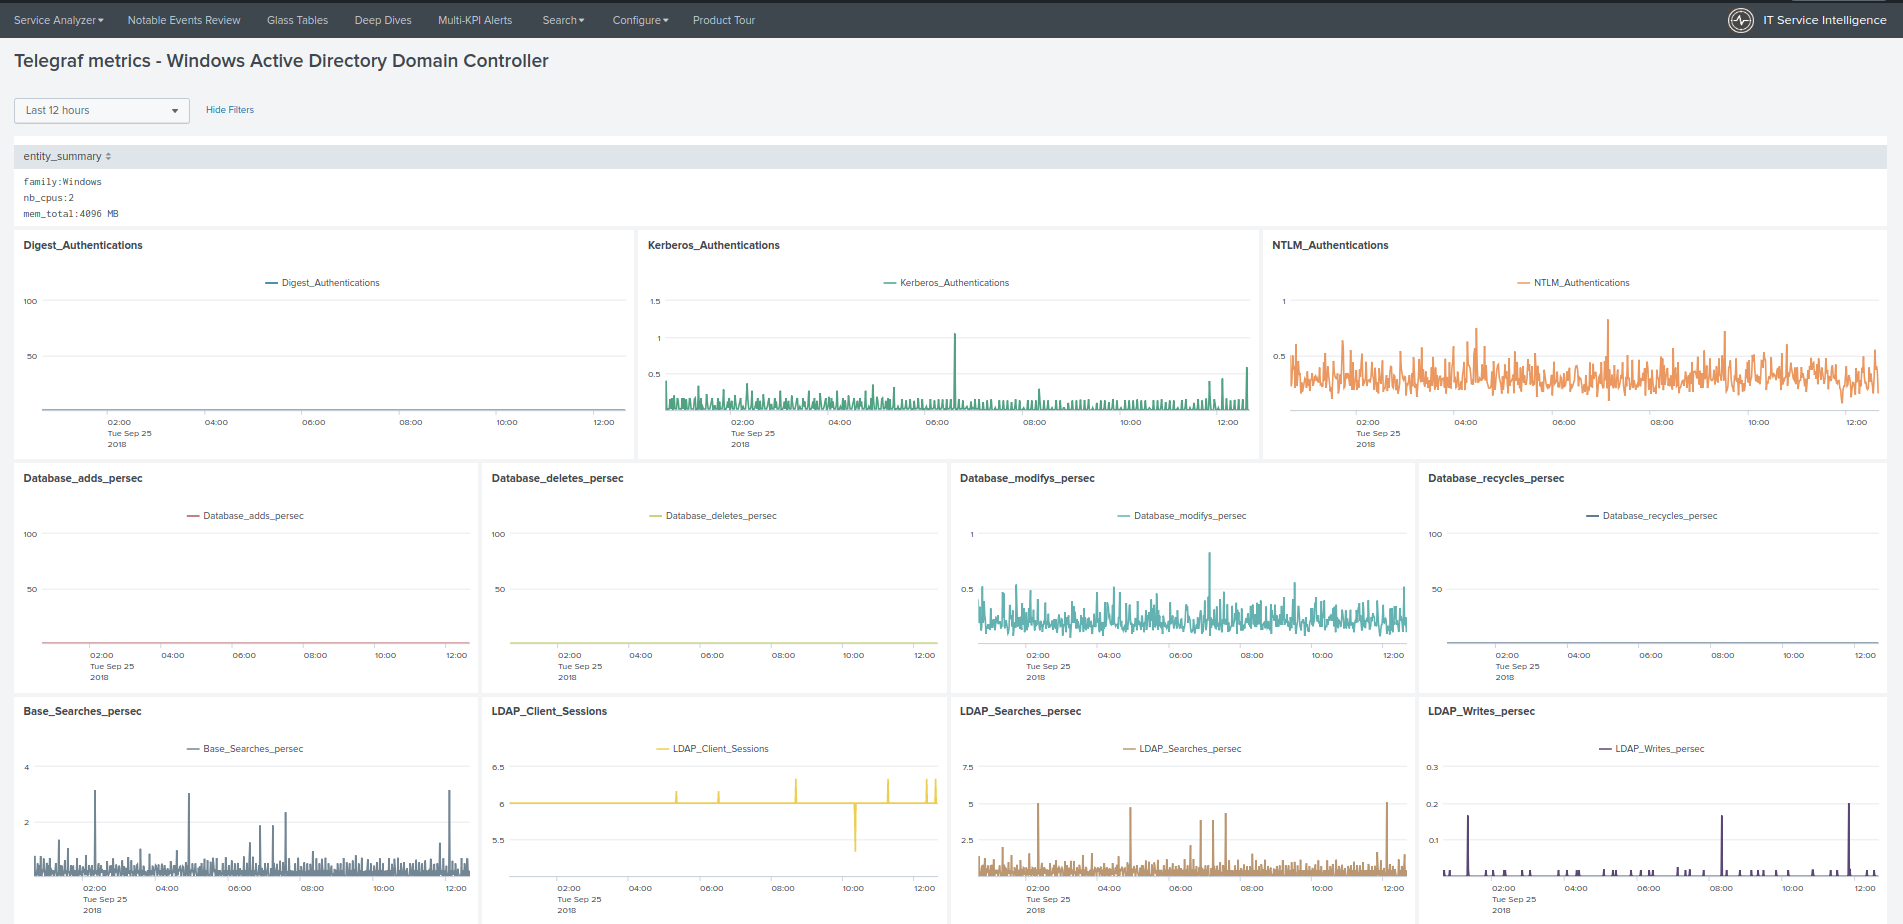
View for Windows Active Directory Domain Controller
The Health view automatically appears as “Telegraf Win AD-DC” deepdive drilldown link when entities are discovered:
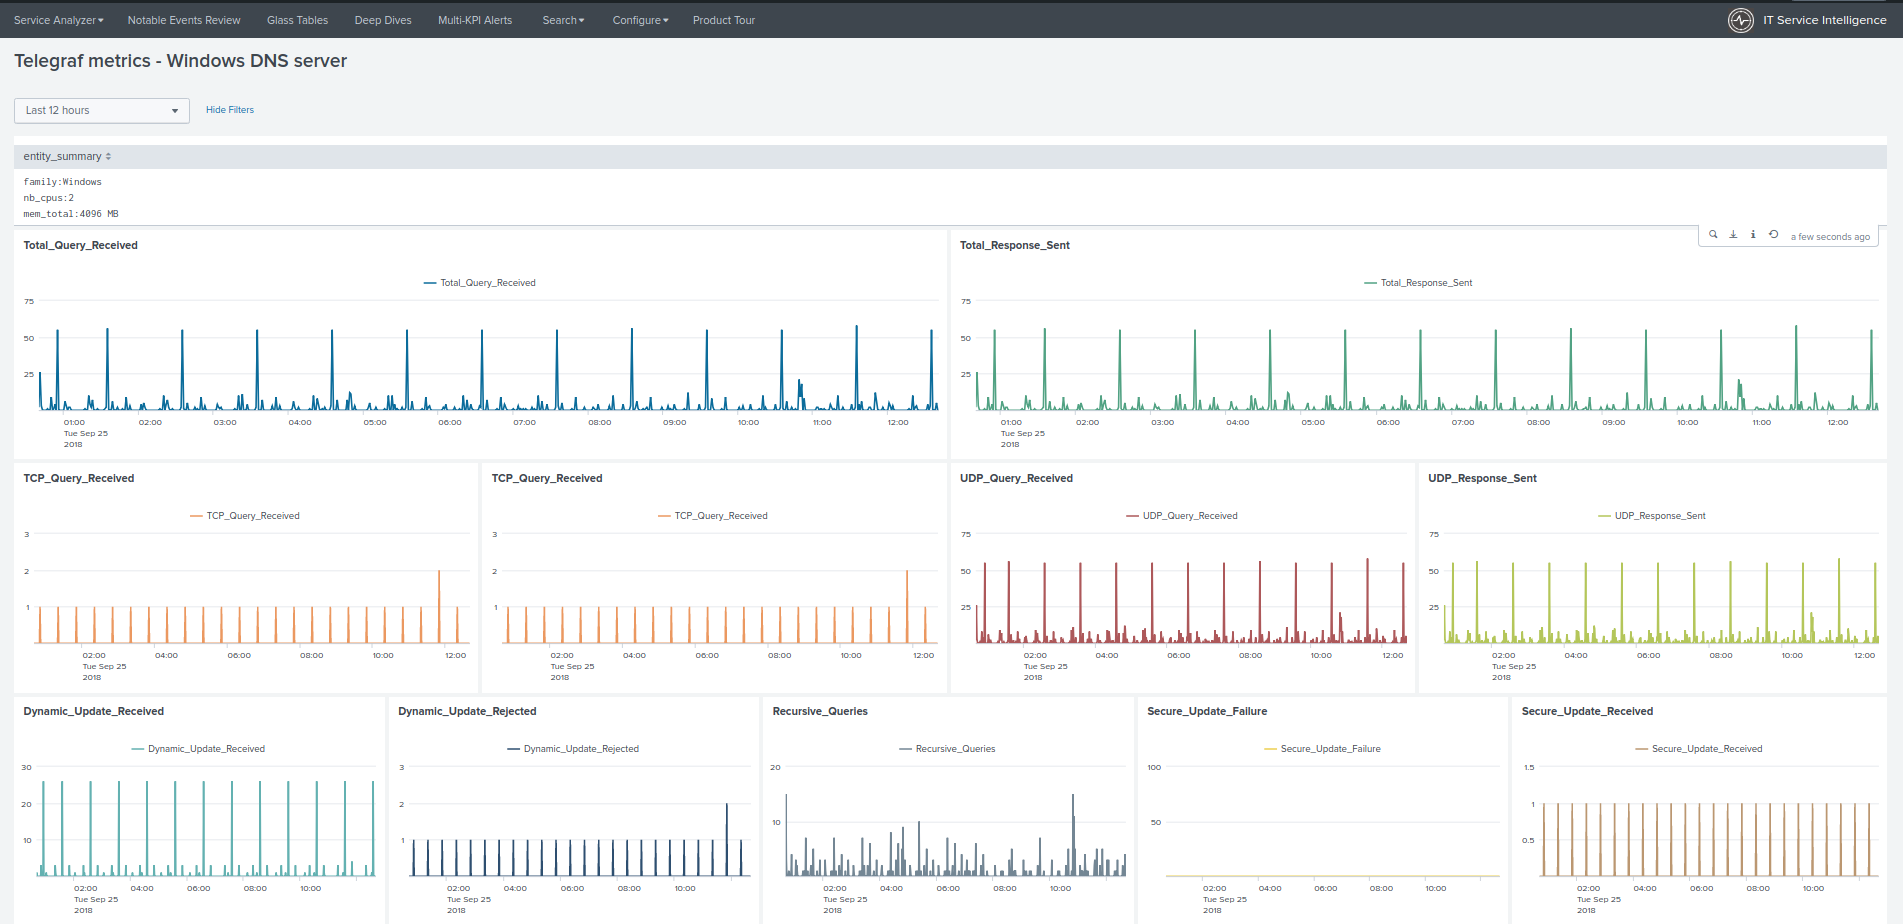
View for Windows DNS
The Health view automatically appears as “Telegraf Win AD-DC” deepdive drilldown link when entities are discovered:
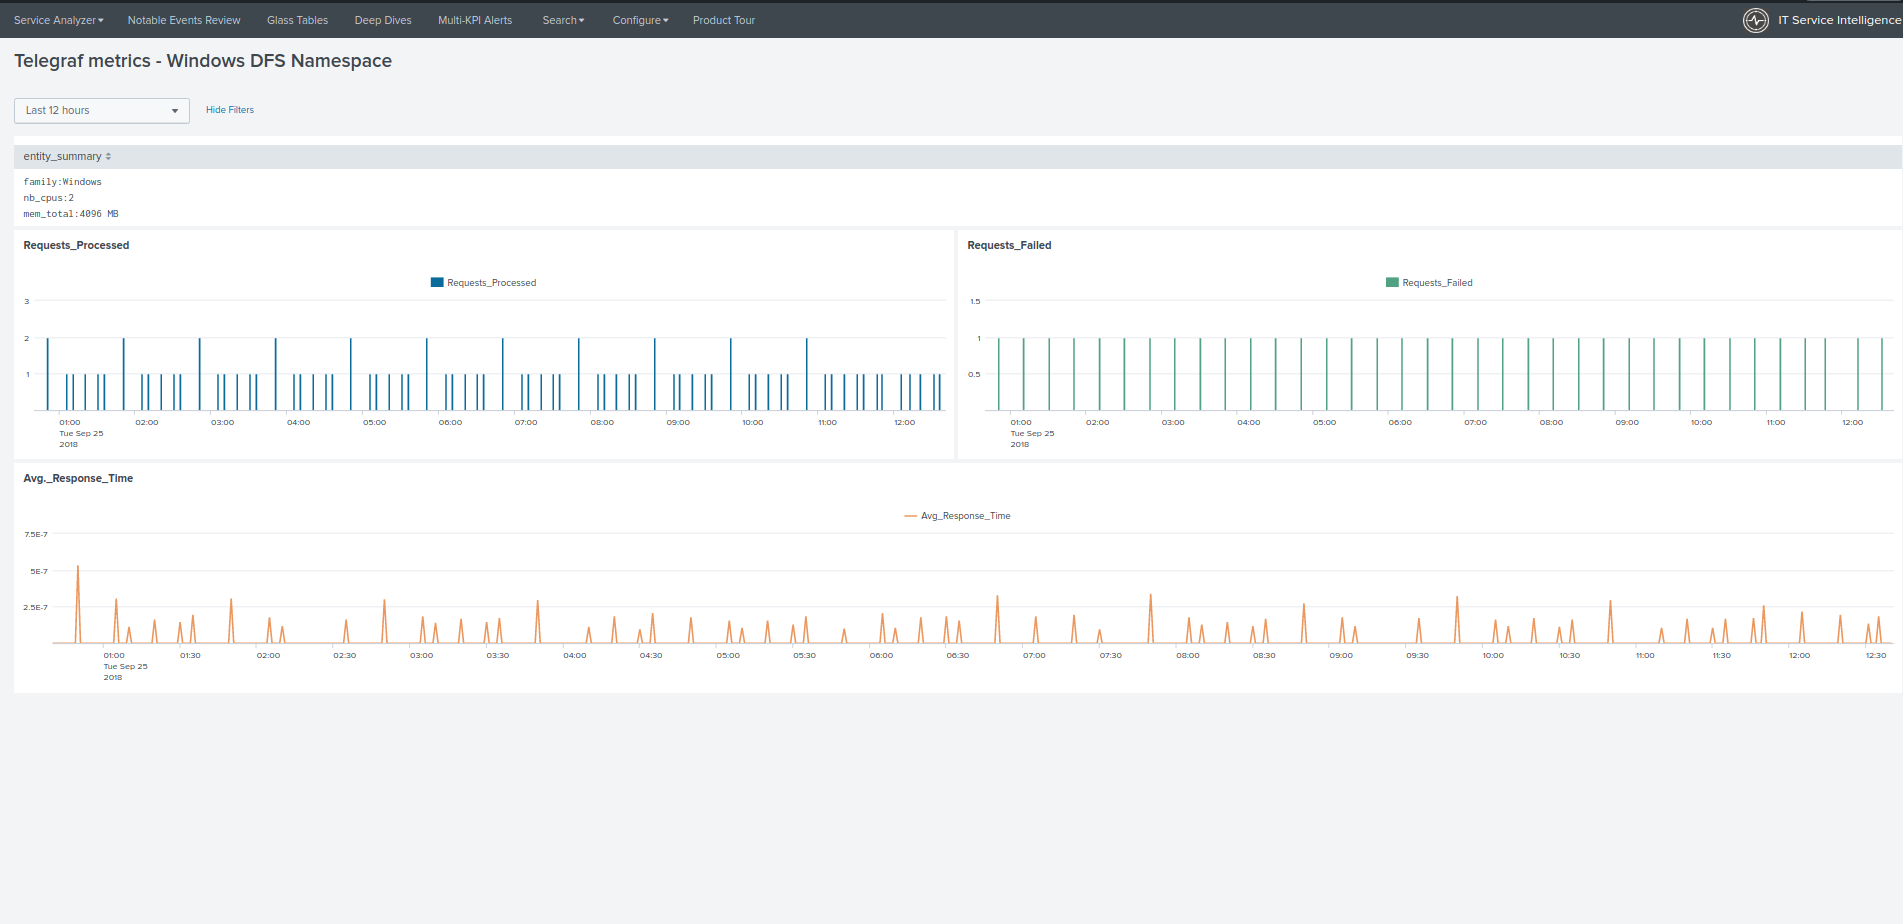
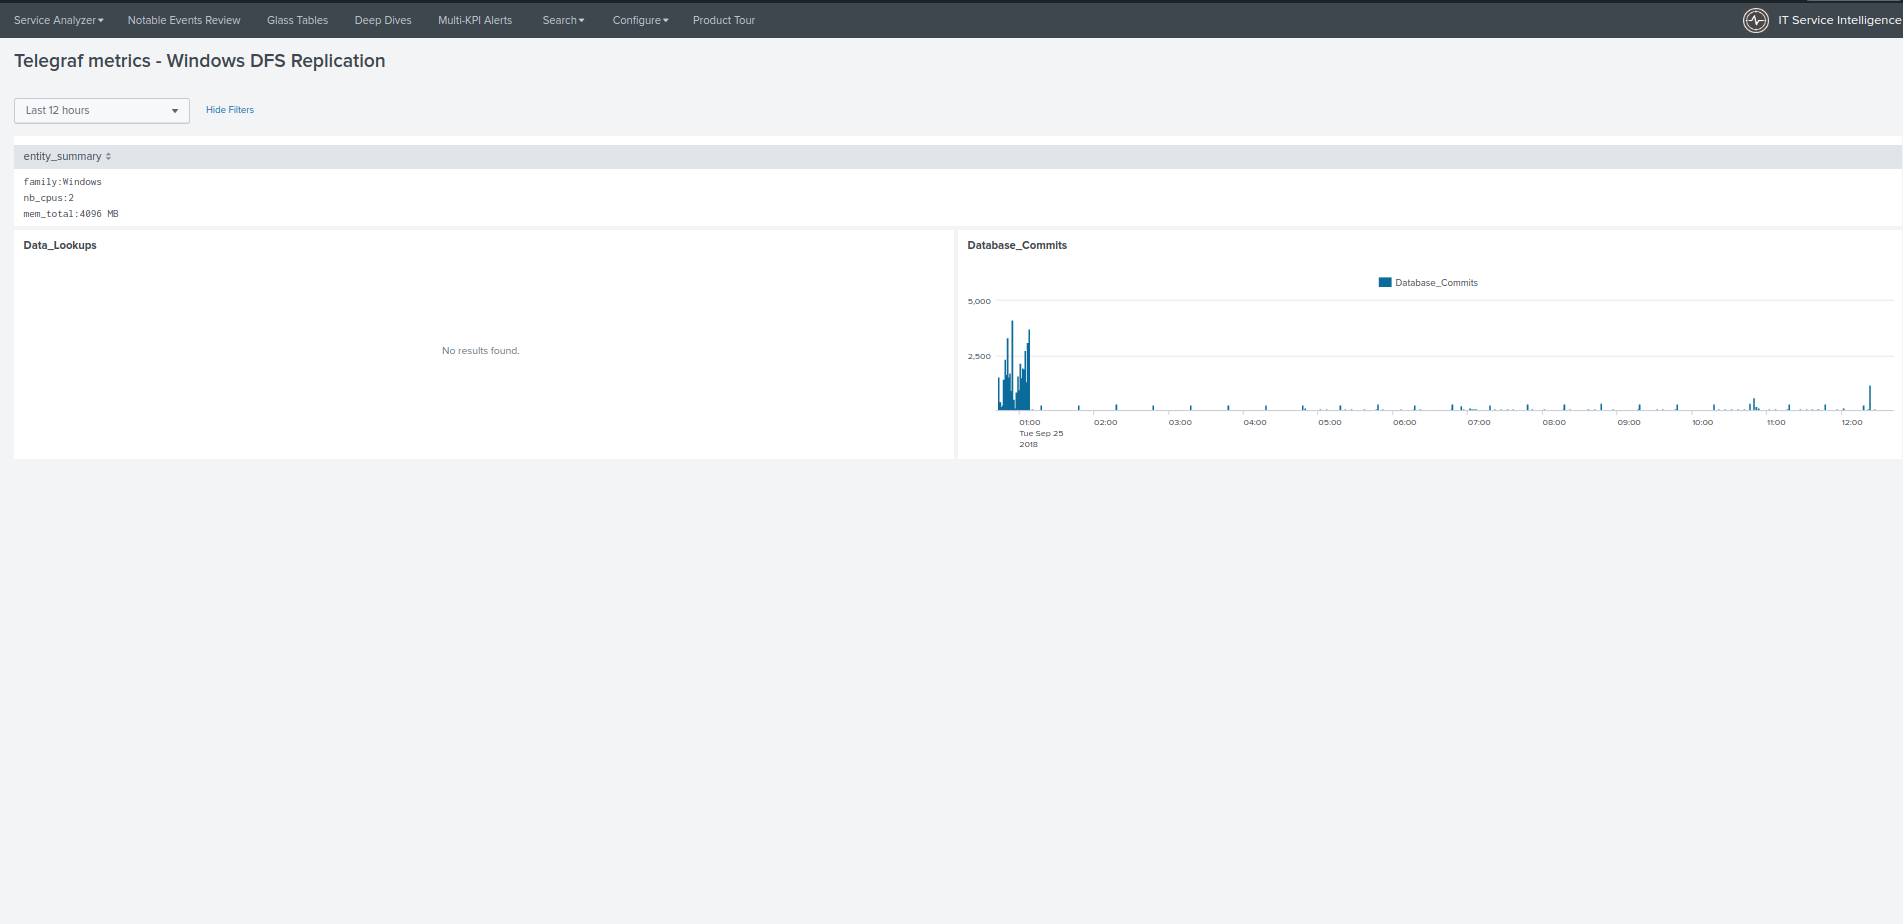
View for Windows DFS
The Health view automatically appear as “Telegraf Win DFS-NS” and “Telegraf Win DFS-REP” deepdive drilldown links when entities are discovered:
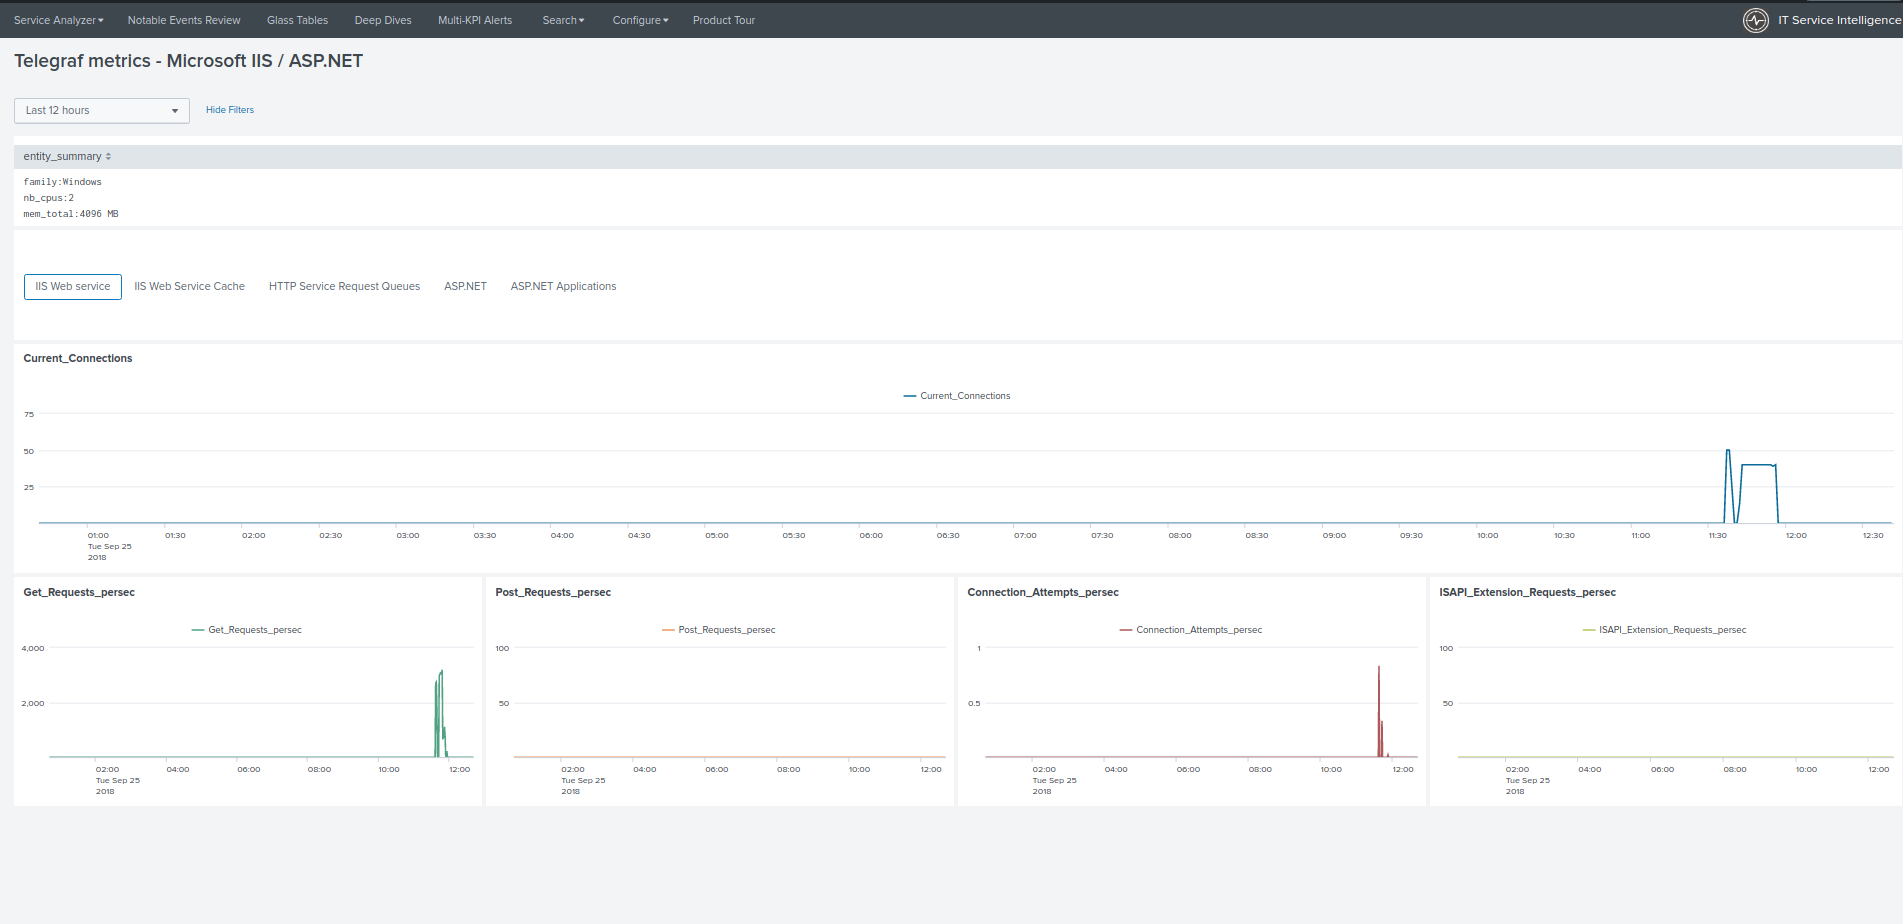
View for Microsoft IIS/ASP.NET
The Health view automatically appears as “Telegraf IIS / ASP.NET” deepdive drilldown links when entities are discovered: